Archive for March, 2010

Your Cheatin’ Chart Will Tell On You

Tuesday, March 30th, 2010

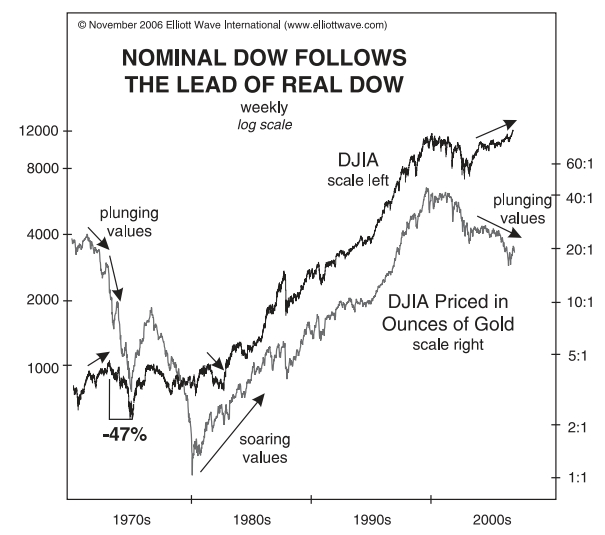
By Elliott Wave International

"Your cheating chart will tell on you."

Hank Williams may not have known about Elliott waves, but he did know when a story doesn't add up.

Such is the case with the nominal rise of the Dow Jones Industrials from 2000 to 2007. In the language of country music, this stock index has a "Cheatin' Chart" — it doesn't tell the real story.

Download Robert Prechter's FREE 40-Page Gold and Silver eBook. This valuable ebook explores the role of gold in today's markets like no other resource has attempted. You will get more than Prechter's long-term outlook on gold and silver; you'll also learn how gold still plays an important role in determining the real value behind nominal share prices. Learn more, and download your Gold and Silver eBook here.

You don't have to tell Bob Prechter this: He knows. A simple price chart of the Dow is, well, a bit too simple. First Bob explains that pricing via fiat currency is not the same as pricing the Dow in terms of real money (namely gold). Then he shows the difference.

For six long years, we've had declining real values in stocks. Since the 2002 bottom, we've had rising values in nominal terms. This is the same set-up that we saw in the early '70s except for one thing: it's bigger. . .Ultimately, real prices are leading dollar prices, and we're going to see a tremendous drop in the dollar price of the Dow as well, because I'm making a case that this is a much bigger top.
Elliott Wave Theorist, December 2006

nominal dow follows the lead of real dow

If gold were our money, the major stock market indexes would have declined relentlessly from 2000 to the present, with a muted bounce in 2003. There would be no arguing the point of whether a bull or bear market was in force.
Elliott Wave Theorist, March 2006

This "oh-so-true" chart of the DJIA priced in gold showed the path that the "cheatin'" nominal Dow would eventually follow. Our forecast was that it's just a matter of time. This analysis has played out as expected several times since the 1999 high in the Dow Jones Industrials.

The July 1999 top in the real Dow was the first in a long succession of rolling blow-offs that (The Elliott Wave Financial Forecast) successfully identified From the DJIA's orthodox top in 2000 to the NASDAQ's all-time high several weeks later to the top in residential real estate prices in 2005 to the nominal peaks in major stock indexes in 2007 to the wild commodity spikes in 2008, EWFF managed to anticipate many of the markets major trend changes. . .We owe these forecasting successes to the Wave Principle and its reflection of market psychology and its foreshadowing of larger social forces.
Elliott Wave Financial Forecast, July 2009

The monthly Elliott Wave Financial Forecast keeps a tireless eye on stocks, real estate, commodities and much more. We also keep track of the precious metals and the dollar — and even keep our finger on the pulse of developing social trends.

The quotes above confirm the power of Elliott wave analysis in identifying market turns in various asset classes.

Download Robert Prechter's FREE 40-Page Gold and Silver eBook. This valuable ebook explores the role of gold in today's markets like no other resource has attempted. You will get more than Prechter's long-term outlook on gold and silver; you'll also learn how gold still plays an important role in determining the real value behind nominal share prices. Learn more, and download your Gold and Silver eBook here.

Elliott Wave International (EWI) is the world's largest market forecasting firm. EWI's 20-plus analysts provide around-the-clock forecasts of every major market in the world via the internet and proprietary web systems like Reuters and Bloomberg. EWI's educational services include conferences, workshops, webinars, video tapes, special reports, books and one of the internet's richest free content programs, Club EWI.


Fibonacci Techniques for Math Geeks and Everyone Else, Too

Monday, March 29th, 2010

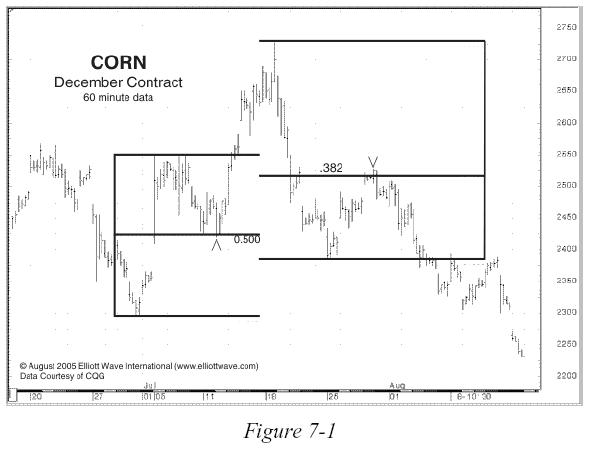
By Editorial Staff

The word Fibonacci (pronounced fib-oh-notch-ee) can draw either blank stares or an enthusiastic response. There's hardly any in-between ground. But for those who ask how an esoteric mathematical relationship can apply to price charts and trading, here's a quick lesson. Everyone who uses Elliott wave analysis will sooner or later want to try using Fibo techniques, and Elliott Wave International's Jeff Kennedy has written about five of them in a Trader's Classroom column. For an example of why people are so fascinated by Fibonacci, read part of Kennedy's article here:

* * * * *

How to Apply Fibonacci Math to Real-World Trading
Have you ever given an expensive toy to a small child and watched while the child had less fun playing with the toy than with the box that it came in? In fact, I can remember some of the boxes I played with as a child that became spaceships, time machines or vehicles to use on dinosaur safaris.

In many ways, Fibonacci math is just like the box kids enjoy playing with imaginatively for hours on end. It's hard to imagine a wrong way to apply Fibonacci ratios or multiples to financial markets, and new ways are being tested every day. Let's look at just some of the ways I apply Fibonacci math in my own analysis.

Fibonacci Retracements
Financial markets demonstrate an uncanny propensity to reverse at certain Fibonacci levels. The most common Fibonacci ratios I use to forecast retracements are .382, .500 and .618. On occasion, I find .236 and .786 useful, but I prefer to stick with the big three. You can imagine how helpful these can
be: Knowing where a corrective move is likely to end often identifies high-probability trade setups (Figures 7-1 and 7-2).

figure 7-1

figure 7-2

Kennedy then goes on to explain Fibonacci extensions, circles, fans and time, using 11 charts to show what he means. Whether or not you are a math geek, you can learn a lot from this six-page introduction to Fibonacci math.

style="BORDER-RIGHT: #eaeaea 5px solid; PADDING-RIGHT: 10px; BORDER-TOP: #eaeaea 5px solid; PADDING-LEFT: 10px; PADDING-BOTTOM: 10px; BORDER-LEFT: #eaeaea 5px solid; PADDING-TOP: 10px; BORDER-BOTTOM: #eaeaea 5px solid">


Get Your Fibonacci Techniques Right Here
. Jeffrey Kennedy has been using and teaching these techniques for years, and he has written a quick description of five Fibonacci techniques in his Trader's Classroom column — now available to you for free by signing up as a Club EWI member. Read more
about the 6-page
report here.

Elliott Wave International (EWI) is the worlds largest market forecasting firm. EWIs 20-plus analysts provide around-the-clock forecasts of every major market in the world via the internet and proprietary web systems like Reuters and Bloomberg. EWIs educational services include conferences, workshops,
webinars, video tapes, special reports, books and one of the internets richest free content programs, Club EWI.

The Stock Market Is Patterned — Here's Proof

Wednesday, March 24th, 2010

By Editorial Staff

This is an excerpt from Elliott Wave International's free Club EWI resource, "What Can a Fractal Teach Me About the Stock Market?" by EWI's president Robert Prechter.

In the 1930s, Ralph Nelson Elliott described the stock market as a fractal — an object that is similarly shaped at different scales. Scientists today recognize financial markets’ price records as fractals, but they presume them to be of the indefinite variety. Elliott found something different:

You see that each “wave” within the overall structure subdivides in a specific way. If the wave is heading in the same direction as the wave of one larger degree, then it subdivides into five waves. If the wave is heading in the opposite direction as the wave of one larger degree, then it subdivides into three waves (or a variation).

Understanding how the market progresses at all degrees of trend gives you an invaluable perspective. No longer do you have to sift through the latest economic data as if they were tea leaves. You gain a condensed view of the whole panorama of essential trends in human social mood and activity, as far back as the data can take you.

OK, now you try it. Figure 3-7 shows an actual price record. Does this record depict two, three, four or five completed waves? Based on your answer, what would you call for next?

Let’s compare your answer with mine. From the simple idea that a bull market comprises five waves, The Elliott Wave Theorist in September 1982 called for the Dow to quintuple to nearly 4000 and on October 6 announced, “Super bull market underway!” The November 8 issue then graphed the forecast for the expected fifth wave up, as you can see in Figure 3-8.


As you can see, Elliott waves are clear not only in retrospect. They are often — particularly at turning points — quite clear in prospect.

Read the rest of this important report now, free! All you need is to create a free Club EWI profile. Here's what you'll learn:

  • How Is the Stock Market Patterned?
  • The Necessity and Efficiency of .5-3.
  • Examples of Real-World Long-Term Waves: DJIA, Gold, CRB
  • The Fibonacci Sequence in the Wave Principle
  • Why Is the Stock Market Patterned? Investors' Herding Impulse
  • More

Visit Elliott Wave International to learn more about the free "What Can a Fractal Teach Me About the Stock Market?" report.


Elliott Wave International (EWI) is the world’s largest market forecasting firm. EWI’s 20-plus analysts provide around-the-clock forecasts of every major market in the world via the internet and proprietary web systems like Reuters and Bloomberg. EWI’s educational services include conferences, workshops, webinars, video tapes, special reports, books and one of the internet’s richest free content programs, Club EWI.


Take Time from March Madness for 2010's Most Important Investment Report

Friday, March 19th, 2010

By Editorial Staff

You got your brackets filled out before the NCAA Men's Basketball Tournament's opening game on Thursday afternoon. Good — now sit back and enjoy the games. But if you're looking for a good read during the numerous and lengthy time outs, we've got just the thing. It's the most important investment report you will read in 2010. Forget the theoretical and hypothetical sorts of analysis that occupy so much space online. Bob Prechter gives 22 real-life examples of how deflation is beginning to spread in the U.S. economy — along with 13 charts that make the examples even clearer.

You want to know whether to prepare for inflation or deflation? This report will answer your questions. Read this excerpt to see what we mean. Oh, and try to forget that a No. 2 seed (Villanova) almost got upset in the first round and that Georgetown, a No. 3 seed, got beat by Ohio University, a 14 seed.

* * * * *

States Are Broke and Approaching Insolvency
While state “regulators” clamp down on profligate banks, the same states’ legislatures continue to blow money. For years, state governments have been spending every dime they could squeeze out of taxpayers plus all they could borrow. (The lone exception is Nebraska, which prohibits state indebtedness over $100k. Whatever Nebraska’s official position on any other issue, by this action alone it is the most enlightened state government in the union.)

But now even states’ borrowing ability has run into a brick wall, because the basis of their ability to pay interest—namely, tax receipts—is evaporating. The goose—the poor, overdriven taxpayer—is dying, and the production of golden eggs, which allowed state governments to binge for the past 40 years, is falling. The only reason that states did not either default on their loans or drastically cut their spending over the past year is that the federal government sucked a trillion dollars out of the loan market and handed it to countless undeserving entities, including state governments.

“It’s hard to imagine what happens when stimulus money runs out,” says a budget expert. (USA, 10/29/09) But it is not at all hard to imagine what will happen. Conquer the Crash imagined state insolvency seven years ago. The breezy transfer of money from innocent savers to state spenders is going to end, and when it does, states will cut spending and “services” drastically. They will also default on their debts, which will be deflationary.

Elliott Wave International's latest free report puts 2010 into perspective like no other. The Most Important Investment Report You'll Read in 2010 is a must-read for all independent-minded investors. The 13-page report is available for free download now. Learn more here.


Elliott Wave International (EWI) is the world’s largest market forecasting firm. EWI’s 20-plus analysts provide around-the-clock forecasts of every major market in the world via the internet and proprietary web systems like Reuters and Bloomberg. EWI’s educational services include conferences, workshops, webinars, video tapes, special reports, books and one of the internet’s richest free content programs, Club EWI.


What To Do With Your Pension Plan

Tuesday, March 16th, 2010

Enjoy your 8 free chapters from Prechter’s Conquer the Crash — the book that foresaw what others have missed.
March 16, 2010

By Editorial Staff

There is no question that Robert Prechter’s Conquer the Crash foresaw and explained nearly every chapter of today’s financial crisis, years before it happened. Enjoy your 8 free chapters from the book with this free Club EWI report; here’s a quick excerpt from chapter 23, “What To Do With Your Pension Plan.” Note especially the last two paragraphs.

Make sure you fully understand all aspects of your government’s individual retirement plans. In the U.S., this includes such structures as IRAs, 401Ks and Keoghs. If you anticipate severe system-wide financial and political stresses, you may decide to liquidate any such plans and pay whatever penalty is required. Why?

Because there are strings attached to the perk of having your money sheltered from taxes. You may do only what the government allows you to do with the money. It restricts certain investments and can change the list at any time. It charges a penalty for early withdrawal and can change the amount of the penalty at any time.

What is the worst that could happen? In Argentina, the government continued to spend more than it took in until it went broke trying to pay the interest on its debt. In December 2001, it seized $2.3 billion dollars worth of deposits in private pension funds to pay its bills.

In the 1930s, the world heard a lot of populist rhetoric about why “rich” people should be plundered for the public good. It is easy to imagine such talk in the next crisis, directed at requiring wealthy people to forfeit their retirement savings for the good of the nation.

With the retirement setup in the U.S., the government need not be as direct as Argentina’s. It need merely assert, after a stock market fall decimates many people’s savings, that stocks are too risky to hold for retirement purposes. Under the guise of protecting you, it could ban stocks and perhaps other investments in tax-exempt pension plans and restrict assets to one category: “safe” long-term U.S. Treasury bonds.

Then it could raise the penalty of early withdrawal to 100 percent. Bingo. The government will have seized the entire $2 trillion — or what’s left of it given a crash — that today is held in government-sponsored, tax-deferred 401K private pension plans. I’m not saying it will happen, but it could, and wouldn’t you rather have your money safely under your own discretion?

Read the rest of Conquer the Crash Chapter 23, “What To Do With Your Pension Plan,” online now, free!  Right now, you can download the 8-chapter Conquer the Crash Collection, free. It includes:Chapter 10: Money, Credit And The Federal Reserve Banking System
Chapter 13: Can The Fed Stop Deflation?
Chapter 23: What To do With Your Pension Plan
Chapter 28: How To Identify A Safe Haven
Chapter 29: Calling In Loans & Paying Off Debt
Chapter 30: What You Should Do If You Run A Business
Chapter 32: Should You Rely On The Government To Protect You?
Chapter 33: Short List of Imperative ‘Do’s’ & ‘Don’ts”

Visit Elliott Wave International to learn more about the free Conquer the Crash Collection.


Elliott Wave International (EWI) is the world’s largest market forecasting firm. EWI’s 20-plus analysts provide around-the-clock forecasts of every major market in the world via the internet and proprietary web systems like Reuters and Bloomberg. EWI’s educational services include conferences, workshops, webinars, video tapes, special reports, books and one of the internet’s richest free content programs, Club EWI.

What Can Movies Tell You About the Stock Market?

Monday, March 15th, 2010

By Editorial Staff

The following article is adapted from a special report on "Popular Culture and the Stock Market" published by Robert Prechter, founder and CEO of the technical analysis and research firm Elliott Wave International. Although originally published in 1985, "Popular Culture and the Stock Market" is so timeless and relevant that USA Today covered its insights in a recent Nov. 2009 article. For the rest of this revealing 50-page report, download it for free here.

This year's Academy Awards gave us movies about war (The Hurt Locker), football (The Blind Side), country music (Crazy Heart) and going native (Avatar), but nowhere did we see a horror movie nominated. In fact, it looks like Sweeney Todd, The Demon Barber of Fleet Street was the most recent to be nominated in 2008, for art direction (which it won), costume design and best actor, although the last one to win major awards for Best Picture, Director, Actor and Actress was The Silence of the Lambs in 1991.

Whether horror films win Academy Awards or not, they tell an interesting story about mass psychology. Research here at Elliott Wave International shows that horror films proliferate during bear markets, whereas upbeat, sweet-natured Disney movies show up during bull markets. Since the Dow has been in a bear-market rally for a year, now is not the time for horror films to dominate the movie theaters. But their time will come again.

In the meantime, to catch up on why all kinds of pop culture — including fashion, art, movies and music — can help to explain the markets, take a few minutes to read a piece called Popular Culture and the Stock Market, which Bob Prechter wrote in 1985. Here's an excerpt about horror movies as a sample.

* * * * *

From Popular Culture and the Stock Market by Bob Prechter

While musicals, adventures, and comedies weave into the pattern, one particularly clear example of correlation with the stock market is provided by horror movies. Horror movies descended upon the American scene in 1930-1933, the years the Dow Jones Industrials collapsed. Five classic horror films were all produced in less than three short years. Frankenstein and Dracula premiered in 1931, in the middle of the great bear market. Dr. Jekyll and Mr. Hyde played in 1932, the bear market bottom year and the only year that a horror film actor was ever granted an Oscar. The Mummy and King Kong hit the screen in 1933, on the double bottom. These are the classic horror films of all time, along with the new breed in the 1970s, and they all sold big. The message appeared to be that people had an inhuman, horrible side to them. Just to prove the vision correct, Hitler was placed in power in 1933 (an expression of the darkest public mood in decades) and fulfilled it. For thirteen years, lasting only slightly past the stock market bottom of 1942, films continued to feature Frankenstein monsters, vampires, werewolves and undead mummies. Ironically, Hollywood tried to introduce a new monster in 1935 during a bull market, but Werewolf of London was a flop. When film makers tried again in 1941, in the depths of a bear market, The Wolf Man was a smash hit.

Shortly after the bull market in stocks resumed in 1942, films abandoned dark, foreboding horror in the most sure-fire way: by laughing at it. When Abbott and Costello met Frankenstein, horror had no power. That decade treated moviegoers to patriotic war films and love themes. The 1950s gave us sci-fi adventures in a celebration of man’s abilities; all the while, the bull market in stocks raged on. The early 1960s introduced exciting James Bond adventures and happy musicals. The milder horror styles of the bull market years and the limited extent of their popularity stand in stark contrast to those of the bear market years.

Then a change hit. Just about the time the stock market was peaking, film makers became introspective, doubting and cynical. How far the change in cinematic mood had carried didn’t become fully clear until 1969-1970, when Night of the Living Dead and The Texas Chainsaw Massacre debuted. Just look at the chart of the Dow [not shown], and you’ll see the crash in mood that inspired those movies. The trend was set for the 1970s, as slice-and-dice horror hit the screen. There also appeared a rash of re-makes of the old Dracula and Frankenstein stories, but as a dominant theme, Frankenstein couldn’t cut it; we weren’t afraid of him any more.

Hollywood had to horrify us to satisfy us, and it did. The bloody slasher-on-the-loose movies were shocking versions of the ’30s’ monster shows, while the equally gory zombie films had a modern twist. In the 1930s, Dracula was a fitting allegory for the perceived fear of the day, that the aristocrat was sucking the blood of the common people. In the 1970s, horror was perpetrated by a group eating people alive, not an individual monster. An army of dead-but-moving flesh-eating zombies devouring every living person in sight was a fitting allegory for the new horror of the day, voracious government and the welfare state, and the pressures that most people felt as a result. The nature of late ’70s’ warfare ultimately reflected the mass-devouring visions, with the destruction of internal populations in Cambodia and China.

Learn what's really behind trends in the stock market, music, fashion, movies and more… Read Robert Prechter's Full 50-page Report, "Popular Culture and the Stock Market," FREE


Elliott Wave International (EWI) is the world’s largest market forecasting firm. EWI’s 20-plus analysts provide around-the-clock forecasts of every major market in the world via the internet and proprietary web systems like Reuters and Bloomberg. EWI’s educational services include conferences, workshops, webinars, video tapes, special reports, books and one of the internet’s richest free content programs, Club EWI.


Paper Trading Is NOT What Will Teach You To Trade

Thursday, March 11th, 2010

By Editorial Staff

This is an excerpt from Elliott Wave International's free Club EWI resource, "What a Trader Really Needs to be Successful" — a classic Special Report by EWI's president Robert Prechter.

3. Experience. Some people advocate "paper trading" as a learning tool. Paper trading is useful for the testing of methodology, but it is of no value in learning about trading. In fact, it can be detrimental, by imbuing the novice with a false sense of security in "knowing" that he has successfully paper traded the past six months, thus believing that the next six months with real money will be no different. In fact, nothing could be further from the truth. Why?

Because the markets are not merely an intellectual exercise. They are an emotional (and in extreme cases, even physical) one as well. If you buy a computer baseball game and become a hitting expert with the joystick while sitting quietly alone on the floor of your living room, you may conclude that you are one talented baseball player. Now let the Mean Green Giant reach in, pick you up, and place you in the batter's box at the bottom of the ninth inning in the final game of the World Series with your team behind by one run, the third base coach flashing signals one after another, a fastball heading toward your face at 90 m.p.h., and sixty beer soaked fans in the front row screaming, "Yer a bum! Yer a bum!" Guess what? You feel different!

To put it mildly, you will find it impossible to approach your task with the same cool detachment you displayed in your living room. This new situation is real, it matters, it is physical, it is dangerous, other people are watching, and you are being bombarded with stimuli. This is what your life is like when you are actually speculating. You know it is real, you know it matters, you must physically place orders, you perform under the scrutiny of your broker or clients, your spouse and business acquaintances, and you must operate while thousands of conflicting messages are thrown at you from the financial media, the brokerage industry, analysts, and the market itself.

In short, you must conquer a host of problems, most of them related to battling powerful human emotions, in order to trade real money successfully. The School of Hard Knocks is the only school that will teach it to you, and the tuition is expensive.

There is only one shortcut to obtaining experience, and that is to find a mentor. Locate someone who has proved himself over the years to be a successful trader or investor, and go visit him. You will undoubtedly find that he is very friendly since his runaway ego of yesteryear, which undoubtedly got him involved in the markets in the first place, has long since been humbled. Observe not only what he does, but far more important, what he does not allow himself to do. This person does exist, but it is hard to find him. He will usually welcome the opportunity to tell you what he knows.

Read the rest of this important report, "What a Trader Really Needs to be Successful", now, free! Here's what you'll learn:

4 more items on Prechter's list of requirements for successful trading
Why "You can't go broke taking a profit" is not a universal rule
Why other trading adages are often completely contradictory to each other
More

Learn more, and download this free report here


Elliott Wave International (EWI) is the world’s largest market forecasting firm. EWI’s 20-plus analysts provide around-the-clock forecasts of every major market in the world via the internet and proprietary web systems like Reuters and Bloomberg. EWI’s educational services include conferences, workshops, webinars, video tapes, special reports, books and one of the internet’s richest free content programs, Club EWI.


Learn Elliott Wave Analysis — Free

Friday, March 5th, 2010

By Editorial Staff

Understand the basics of the subject matter, break it down to its smallest parts — and you've laid a good foundation for proper application of… well, anything, really. That's what we had in mind when we put together our free 10-lesson online Basic Elliott Wave Tutorial, based largely on Robert Prechter's classic "Elliott Wave Principle — Key to Market Behavior." Here's an excerpt:

Successful market timing depends upon learning the patterns of crowd behavior. By anticipating the crowd, you can avoid becoming a part of it. …the Wave Principle is not primarily a forecasting tool; it is a detailed description of how markets behave. In markets, progress ultimately takes the form of five waves of a specific structure.

The personality of each wave in the Elliott sequence is an integral part of the reflection of the mass psychology it embodies. The progression of mass emotions from pessimism to optimism and back again tends to follow a similar path each time around, producing similar circumstances at corresponding points in the wave structure.

These properties not only forewarn the analyst about what to expect in the next sequence but at times can help determine one's present location in the progression of waves, when for other reasons the count is unclear or open to differing interpretations.

As waves are in the process of unfolding, there are times when several different wave counts are perfectly admissible under all known Elliott rules. It is at these junctures that knowledge of wave personality can be invaluable. If the analyst recognizes the character of a single wave, he can often correctly interpret the complexities of the larger pattern.

The following discussions relate to an underlying bull market… These observations apply in reverse when the actionary waves are downward and the reactionary waves are upward.

Idealized Elliott Wave Pattern 

1) First waves — …about half of first waves are part of the "basing" process and thus tend to be heavily corrected by wave two. In contrast to the bear market rallies within the previous decline, however, this first wave rise is technically more constructive, often displaying a subtle increase in volume and breadth. Plenty of short selling is in evidence as the majority has finally become convinced that the overall trend is down. Investors have finally gotten "one more rally to sell on," and they take advantage of it. The other half of first waves rise from either large bases formed by the previous correction, as in 1949, from downside failures, as in 1962, or from extreme compression, as in both 1962 and 1974. From such beginnings, first waves are dynamic and only moderately retraced. …

Read the rest of this 10-lesson Basic Elliott Wave Tutorial online now, free! Here's what you'll learn:
  • What the basic Elliott wave progression looks like
  • Difference between impulsive and corrective waves
  • How to estimate the length of waves
  • How Fibonacci numbers fit into wave analysis
  • Practical application tips for the method
  • More

Keep reading this free tutorial today.


Elliott Wave International (EWI) is the world’s largest market forecasting firm. EWI’s 20-plus analysts provide around-the-clock forecasts of every major market in the world via the internet and proprietary web systems like Reuters and Bloomberg. EWI’s educational services include conferences, workshops, webinars, video tapes, special reports, books and one of the internet’s richest free content programs, Club EWI.