Archive for May, 2010
Friday, May 21st, 2010
By Elliott Wave International
As the world's leading stock markets continue to play stomach-hockey with investors via one triple-digit turn after another, the mainstream community takes solace in this core belief: No matter how uncertain things become, the Federal Reserve can at any moment swoop in to set the economy right.
In reality — the Fed has no such power. This is the revelation of Elliott Wave International's newest complimentary resource from Club EWI: the 35-page eBook titled "Understanding the Fed." Including excerpts from the selected works of EWI President Robert Prechter — including his 2002 book "Conquer the Crash" and several past "Elliott Wave Theorist" publications — this riveting report exposes once and for all the most dangerous myths about the Federal Reserve.
Chapter 3 (of the 8-chapter anthology) attends to the "Potent Directors Fallacy" — i.e., the false notion that the central bank is in control of the U.S.'s money, market, and economy — and offers this "Conquer the Crash" insight:
"For recent examples of the failure of the idea of efficacious economic directors, just look around. Since Japan's boom ended, its regulators have been using every presumed macroeconomic 'tool' to get the Land of the Sinking Sun rising again, as yet to no avail. The World Bank, the IMF, local central banks, and government officials were 'wisely managing' South East Asia's boom until it collapsed spectacularly in 1997. In America, the Federal Reserve has lowered its discount rate from 6% to 1.25%, an unprecedented amount in such a short time… What will it do if the economy resumes its contraction; lower rates to zero?"
Note: The underlined sentence above was written in 2002. Today, that forecast has come to fruition after the Fed's rate-slashing campaign since September 2008 has brought rates to the zero level.
Chapter 3 then goes on to explain WHY the Fed's monetary policy failed to lift the hot-air balloon of the economy out of the violent credit and housing downdraft. Here, the eBook writes:
"The Fed's ultimate goal is to influence public borrowing from banks. During economic contractions, banks become fearful. At such times, low Fed-influenced rates cannot overcome creditors' disinclination to lend and/or customers' unwillingness or inability to borrow. Thus, regardless of assertions to the contrary, the Fed's purported 'control' of borrowing, lending, and interest rates ultimately depends upon an accommodating market psychology and cannot be set by decree."
Once again, flash ahead to today and the disintegration of optimism and shift toward conservation can be seen in the following data from February 2010:
- Year-over-year bank credit was (negative) - 6.8% vs. 10% in 2007
- Loan availability to small businesses plunged to the lowest level since interest rate crisis of 1980, thus drying up a major means of debt repayment.
- The number of banks tightening their lending standards has soared, while consumer credit and tax revenue is plunging.
- And, residential and commercial mortgages are plunging, as more and more home/business owners are walking away from their leases.
In Bob Prechter's own words: Once you can assimilate the truths contained in this eBook, "you will have knowledge of the banking system that one person in 10,000 has."
Do you want to really understand the Fed? Then keep reading this free eBook, "Understanding the Fed", as soon as you become a free member of Club EWI.
This article was syndicated by Elliott Wave International. EWI is the world's largest market forecasting firm. Its staff of full-time analysts lead by Chartered Market Technician Robert Prechter provides 24-hour-a-day market analysis to institutional and private investors around the world.
Posted in Economy | No Comments »
Friday, May 14th, 2010
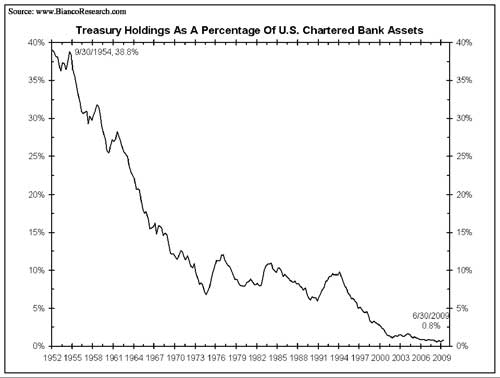
By Editorial Staff, Elliott Wave International
The following market analysis is courtesy of Bob Prechter's Elliott Wave International. Elliott Wave International is currently offering Bob's recent Elliott Wave Theorist, free.
Continuing—and Looming—Deflationary Forces The Fed and the government quite effectively advertise their efforts to inflate the supply of money and credit. But deflationary forces, to most eyes, are invisible. I thought I would point some of them out.
1. Banks Are about 95 Percent Invested in Mortgages
.JPG)
Figure 4, courtesy of Bianco Research, shows that U.S. banks used to be fairly conservative, holding 40 percent of their assets in Treasury securities. This large investment in federal government debt, the basis of our “monetary” “system”, served as a stop-gap against deflation. In 1950, even if mortgages had been wiped out by a factor of 80 percent, banks still would have been 50% solvent and 40% liquid. Today, banks hold federal agency securities (backed mostly by mortgages), mortgage-backed securities (meaning complicated packages of mortgages), plain old mortgages that they financed themselves, and a few business loan contracts. If these mortgages become wiped out by a factor of 80 percent, which in turn would cause many of the business loans to go into default, the banks will be only about 22% solvent and 1% liquid. I believe the coming wipeout will be bigger than that, but let’s be conservative for now. The point is that, unlike Treasuries, IOUs with homes as collateral can fall in dollar value, and such IOUs are pretty much the only paper backing U.S. bank deposits. The potential for deflation here is tremendous.
2. More Mortgages Are Going Under
It has been well publicized recently that commercial real estate has been plunging in value as business tenants walk away from their leases, leaving properties empty. Zisler Capital Partners reports, “Returns were negative for the past five quarters, the longest streak since 1992. Property prices have fallen by 30 percent to 50 percent from their peaks. Much of the debt is likely worth about 50 percent of par, or less.” (Bloomberg, 11/11) Needless to say, the fact that commercial mortgages are plunging in value is stressing banks even further, which in turn restricts their lending. This trend is deflationary.
3. People Are Walking away from Their Homes and Mortgages
Great numbers of people are ceasing to pay their mortgages, even if they have the money to pay them. When people walk away from their mortgages, they are reneging on a promise to pay the interest on the loan. … Refusal to pay interest is deflationary. When banks can’t collect fully on their loan principal, as is the case by law in the above-named states, it is deflationary. Even in states where banks can go after other assets held by borrowers, default is still deflationary if the borrowers are broke. The reason is that, in all these cases, the value of the loan contract falls to the marketable value of the collateral, and a contraction in the value of debt is deflation.
Some people who walk away from their mortgages purposely damage the homes when they leave. New businesses have sprung up to take on the job of cleaning up the houses that former occupants trashed as they left. Angry defaulters are stripping coils out of stoves, pulling electrical wiring out of walls, ripping fixtures out of bathrooms, yanking seats off of toilets, punching holes in walls and leaving rotting food in the fridge. (AP, 8/9) Such actions, and the threat of more such actions, lower the value of the collateral behind mortgage debts, thereby lowering the value of mortgages, which is deflationary.
4. Bank Lending Standards Have Stayed Restrictive
.JPG)
As people default on mortgages, banks are tightening lending standards. Figure 7 shows that banks loosened credit standards from late 2003 through the summer of 2007. By the end of that time, you could borrow money if you were breathing and could operate a ball-point pen. Banks have been tightening credit standards ever since. The rate of tightening peaked in October 2008, but the graph shows that over the past year various banks have either left their new, tighter standards in place or continued to tighten their standards further. Across the board, it is harder to get a loan, and it’s staying that way. Lending restrictions reduce the credit supply. This condition is deflationary.
5. Banks Are Cashing Out of the Credit-Card Business
.JPG)
Articles have revealed that banks are doing everything they can to get credit-card debtors to pay off their cards. They are raising penalties and rates, lowering ceilings and otherwise bugging their clients to pay up, one way or another: Transfer your debt to another bank’s card; default; pay us off; we don’t care which. And it’s working. Through September, consumers have paid down credit card balances for 12 months in a row. Figure 8 shows the new trend. The credit-card business was another formerly humming engine of credit that is sputtering. You might call the new program “cash from clunkers,” and it is deflationary.
For more information from Robert Prechter, download a FREE 10-page issue of The Elliott Wave Theorist. It challenges current recovery hype with hard facts, independent analysis, and insightful charts. You'll find out why the worst is NOT over and what you can do to safeguard your financial future.
This article was syndicated by Elliott Wave International. EWI is the world's largest market forecasting firm. Its staff of full-time analysts lead by Chartered Market Technician Robert Prechter provides 24-hour-a-day market analysis to institutional and private investors around the world.
Posted in Economy | 1 Comment »
Friday, May 7th, 2010
Editor's Note: The following article is excerpted from Robert Prechter's April 2010 issue of the Elliott Wave Theorist. For a limited time, you can visit Elliott Wave International to download the full 10-page issue, free.
By Robert Prechter, CMT
Technical Indicators
It is rare to have technical indicators all lined up on one side of the ledger. They were lined up this way—on the bullish side—in late February-early March of 2009. Today they are just as aligned but on the bearish side. Consider this short list:
- The latest report shows only 3.5% cash on average in mutual funds. This figure matches the all-time low, which occurred in July 2007, the month when the Dow Industrials-plus-Transports combination made its all-time high. But wait. The latest report pertains only through February. In March, the market rose virtually every day, so there is little doubt that the percentage of cash in mutual funds is now at an all-time low, lower than in 2000, lower than in 2007! We will know for sure when the next report comes out in early May. Regardless, the confidence that mutual fund managers and investors express today for a continuation of the uptrend rivals their optimism of 2000 and 2007, times of the two most extreme expressions of stock-market optimism ever.
- The 10-day moving average of the CBOE Equity Put/Call Ratio has fallen to 0.45, which means that the volume of trading in calls has been more than twice that in puts. So, investors are interested primarily in betting on further rising prices, not falling prices, and that’s bearish. The current reading is less than half the level it was thirteen months ago and its lowest level since the all-time peak of stock market optimism from January 1999 to September 2000, the month that the NYSE Composite Index made its orthodox top. The 30-day average stands at 0.50, the lowest reading since October 2000. It took years of relentless rise following the 1987 crash for investors to get that bullish. This time, it’s taken only 13 months.
- The VIX, a measure of volatility based on options premiums, has been sitting at its lowest level since May 2008, when wave (2) of ((1)) peaked out and led to a Dow loss of 50% over the next ten months. Low premiums indicate complacency among options writers. The quants who designed the trading systems that blew up in 2008 generally assumed that low volatility meant that the market was safe, so at such times they would advise hedge funds to raise their leverage multiples. But low volatility is actually the opposite, a warning that things are about to change. The fact that the options market gets things backward is a boon to speculators. Whenever options writers are selling options cheap, the market is likely to move in a big way. Combined with the readings on the Equity Put/Call Ratio, puts right now are a bargain.
- In October 2008 at the bottom of wave 3 of (3) of ((1)), the Investors Intelligence poll of advisors (which has categories of bullish, bearish and neutral), reported that more than half of advisors were bearish. In December 2009, it reported only 15.6% bears. This reading was the lowest percentage since April 1987, 23 years ago! As happens going into every market top, the ratio has moderated a bit, to 18.9% bears. In 1987, the market also rallied four months past the extreme in advisor sentiment. Then it crashed. The bull/bear ratio in October 2008 was 0.4. In the past five months, it has been as high as 3.4.
- The Daily Sentiment Index, a poll conducted by Trade-Futures.com, reports the percentage of traders who are bullish on the S&P. The reading has been registering highs in the 86-92% range ever since last September. Prior to recent months, the last time the DSI saw even a single day’s reading at 90% was June 2007. At the March 2009 bottom, only 2% of traders were bullish, so today’s readings make quite a contrast in a short period of time.
- The Dow’s dividend yield is 2.5%. The only market tops of the past century at which this figure was lower are those of 2000 and 2007, when it was 1.4% and 2.1%, respectively. At the 1929 high, it was 2.9%.
- The price/earnings ratio, using four-quarter trailing real earnings, has improved tremendously, from 122 to 23. But 23 is in the area of the peak levels of P/E throughout the 20th century. Ratios of 6 or 7 occurred at major stock market bottoms during that time. P/E was infinite during the final quarter of 2008, when E was negative. We will see quite a few quarters of infinite P/E from 2010 to 2017.
- The Trading Index (TRIN) is a measure of how much volume it takes to move rising stocks vs. falling stocks on the NYSE. The 30-day moving average of daily closing TRIN readings has been sitting at 0.90, the lowest level since June 2007. This means that it has taken a lot of volume to make rising stocks go up vs. making falling stocks go down over the past 30-plus trading days. It means that buyers of rising stocks are expending more money to get the same result that sellers of declining stocks are getting. Usually long periods of low TRIN exhaust buying power.
For more market analysis and forecasts from Robert Prechter, download the rest of this 10-page issue of the Elliott Wave Theorist free from Elliott Wave International. Learn more here.
Robert Prechter, Chartered Market Technician, is the world's foremost expert on and proponent of the deflationary scenario. Prechter is the founder and CEO of Elliott Wave International, author of Wall Street best-sellers Conquer the Crash and Elliott Wave Principle and editor of The Elliott Wave Theorist monthly market letter since 1979.
Posted in Stock Market | 1 Comment »
|