Most tech stocks lead by Silicon Valley companies had a great run after the 2009 bottom. Nasdaq once again reached above 5000. The Silicon Valley traffic is unbearable, the rents for tech workers are unpayable, housing in the valley challenges prior heights, or already above. Yet the stock market pundits make us believe stock have a lot more to run. Is that really so?
On March 2, the day of the all-time closing highs in the major stock indexes to date, a swift-acting subscriber snapped a photo of this headline on financial news television.
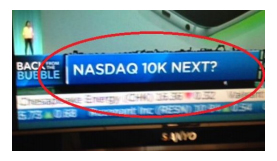
Notice the sub-header: “Back from the bubble.” I think it should read, “Back in the bubble.” But few people agree with that idea.
A new article published on March 3 — which means the interview took place on March 2, the day of the Nasdaq’s high so far — included a revealing quote. The reporter asked a gentleman who started a tech fund in late 1999 (a few months before tech stocked topped and crashed), “Will investors ever see a bubble like the dot-com boom again?” The answer: “It’s unlikely.” Could we not be making the same old mistakes again?
This Q&A is more evidence that people forget their prior moods and rationalize present extremes into normality no matter what is happening around us.
Will we see another bubble? We are in one now, by some measures the biggest one ever. If people do not consider this a bubble, then I guess it makes sense to say that those living will not see one again.
Most articles focusing on the Nasdaq Composite index’s return to 5000 quote professionals saying that this time it’s different: The last time was “dreams,” but this time there are “real profits.
Investors are often non-rational in the past but never now.
It is true that the 2000 top in the tech sector capped a bigger mania than we have today. But today’s condition is still a mania. Last year saw just shy of $50 billion worth of venture capital invested in start-up businesses, most of which are technology companies. The only years of higher investment levels are 1999 and 2000, as the stock market reached its greatest overvaluation ever, by multiples.
2014 is “only” the third-bubbliest year in U.S. stock market history. Yet most bubble talk today excuses the situation. It generally comes in three types:
- “There is no bubble” (that’s from the Fed and most economists);
- “It’s early in a bubble with much more to go” (that’s from the average money manager); and …
- “It’s definitely a bubble, but it’s not as extreme as the last one, so stay invested” (that’s from most other people who’ve commented).
Not everyone lives in the illusion. Mark Cuban gets it. Calling the current tech bubble worse than the last one, he highlights the fact that there is no liquidity underlying angel investors’ huge investments in tech companies. That’s the same message we get from the overall stock market’s low volume. When tech investors and other stock owners decide they want out, low liquidity will mean few buyers, and even willing buyers will have little or no credit available, per the margin-debt statistics cited above.
Money manager Crispin Odey gets it, too. On January 27, he was quoted as saying that the bear market is “likely to be remembered in a hundred years… there will be a painful round of debt default.”
These comments sound like ours here at EWI. The following comments are far more typical:
“There’s no basis to call for a market peak,” [a respected manager of over $9 billion], 71, said today in an interview on Bloomberg Television. “It could be a couple more years. I don’t see signs of euphoria in the stock market,” he said. “Maybe a pocket or two of overpriced equities but, by and large, people have been very conservative in their approach, so that’s not an issue.” (Bloomberg, January 22)
“People are underinvested and continue to want to own this market,” says [a highly regarded technical analyst]. He sees things aligning with the market of the 1950s and early 1960s, when U.S. stocks ultimately rose five-fold. In the current bull market, the S&P 500 has roughly tripled off of 2009’s low, and “if this plays out like I think it will, this is still the early innings of a secular bull run.” (The Wall Street Journal, December 30)
Here’s a headline from this week:
How long can the bull market keep going?
Most analysts expect continuing rise, with no signs of peak on the horizon— Atlanta Journal–Constitution (AP), March 10
Comments in the press in more recent days include: “The United States is back, and ready to drive global growth in 2015.” “Plunging oil prices are a big reason for the optimism.” And: The economy is “like a perfect storm to the upside.”
In the meantime, an incredible 89% of large-cap-stock money managers — who are about 96% invested — have produced less return than the S&P over the past five years:
86% of big-cap fund managers trailed S&P 500 in 2014
In 2014, 86.4% of large-cap equity fund managers underperformed the S&P 500. Over a five-year period, 88.7% of large-cap managers failed to beat the benchmark, and over a 10-year period, 82.1% underperformed. Among mid-cap managers, 66.2% lagged the S&P MidCap 400 on a one-year basis, and 72.9% of small-cap managers lagged the S&P SmallCap 600, S&P Dow Jones Indices said in a news release Thursday. In fixed income, a significant majority of the actively managed funds in the longer-term government bond and longer-term, investment-grade corporate bond categories underperformed their benchmarks, the release said. (Market Watch, March 12)
The reason for this lag is that there is a mania in the benchmark, which managers can’t outperform, while quiet weakness attends a broad list of stocks. The same thing was happening when the S&P was the focus of speculation in 1999.
This article is from Elliott Wave International’s brand-new investment report, ‘Investors Face a Giant, Historic Bubble.‘ It was originally published in the March issue of The Elliott Wave Theorist, published March 13, 2015. EWI has agreed to give our readers exclusive free access to the full report.