A must-read report!
18 charts uncover just how stretched today’s investor optimism has become… and why it’s making today’s market the most dangerous in history.
Check it out – free! Download now!
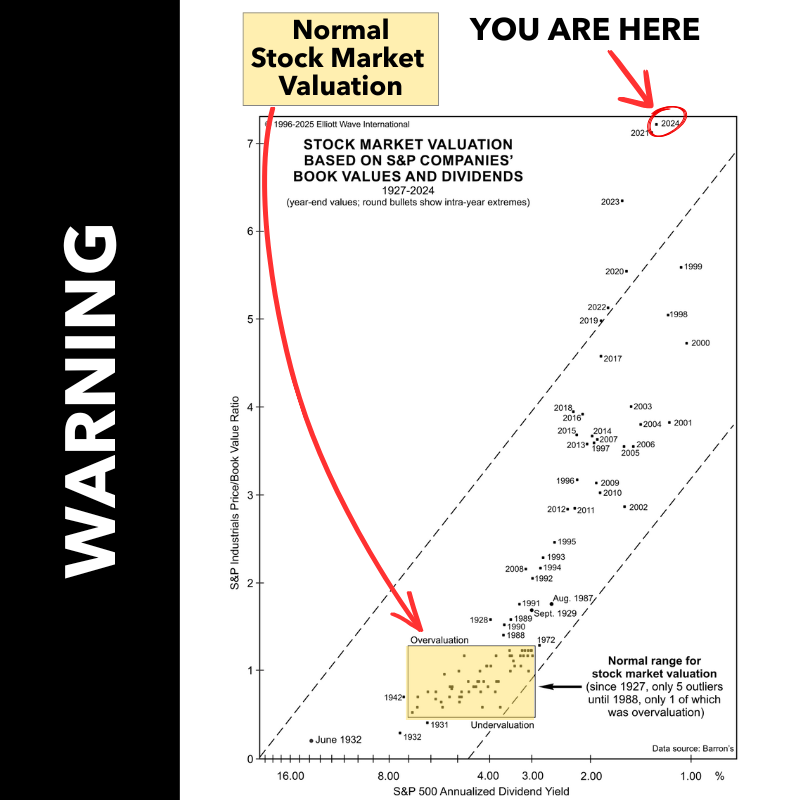
Stocks don’t just look expensive… they’re off the charts.
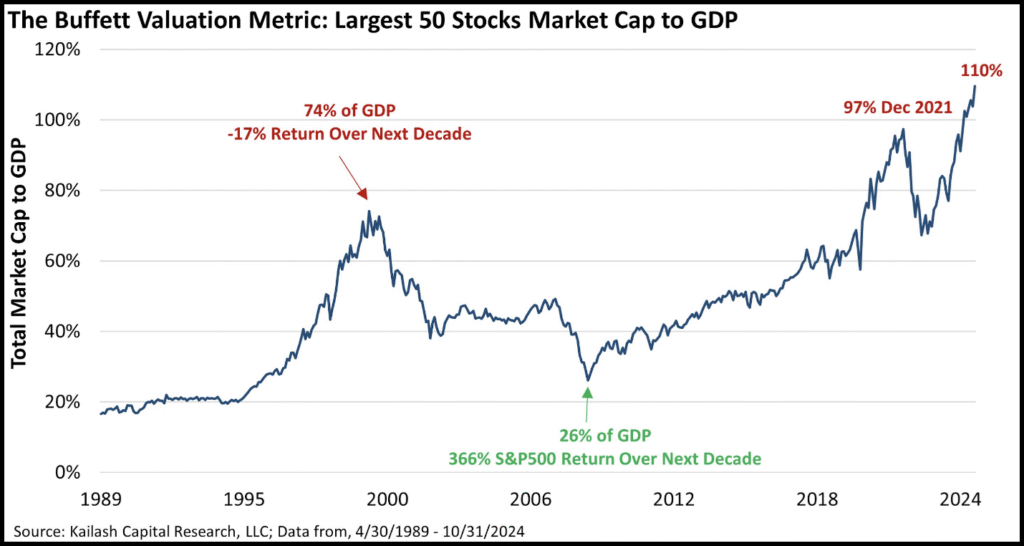
A ratio that’s now 4x higher than 2009’s low.
In 2009, the Buffett Valuation Metric sat at 26% of GDP. Today it’s over 110%!
See this chart + 17 more warning signals in this FREE report from our friends at Elliott Wave International.