What If You Could Spot One of History’s Fastest Rallies Before It Began?
On April 2, while bearish sentiment was extreme and many expected lower prices, subscribers to Elliott Wave International’s Intraday Stocks Pro Services were shown a very different setup in the S&P 500.
In his 3:35 p.m. intraday update, analyst Robert Kelley posted this chart and wrote:
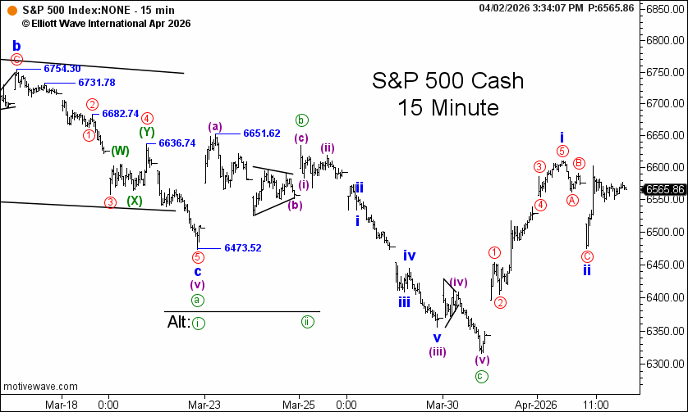
“The larger count labels today’s low as the bottom of a second wave pullback. That’s due to the clear three-wave drop into today’s low. If this count is right there will be a sizable advance next week. For now prices need to hold above 6501.90, the .786 retracement of wave iii so far, to keep this scenario in preferred status.”
The setup was classic Elliott wave analysis: a completed five-wave advance followed by a corrective three-wave decline — a pattern that often signals the trend is preparing to resume.
And notably, this wasn’t a vague bullish opinion. It came with a clearly defined risk level.
What Happened Next?
The labeled wave ii low held. And prices exploded. From that April 2 low, the S&P 500 surged to 7123.76 — a move of roughly +8.8%, part of what Kelley called “one of the fastest rallies in history.”
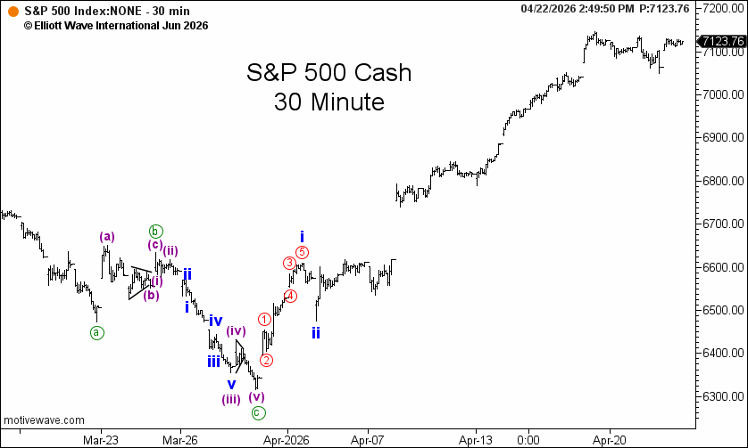
This illustrates how Elliott wave analysis can help identify important market turning points before they become obvious in price or headlines.
Learn the Wave Principle with Robert Kelley
Want to better understand patterns like this? Study with Robert, and 5 other instructors, in Trader’s Classroom. LIMITED TIME — Try Trader’s Classroom for 30 days for just $30 >>.