 |
Why Stock-Market Success Is Usually Only Temporary Here’s a sample of record sentiment readings for stocks Recession coming or not, people are still EXTREMELY bullish. Read this excerpt from the May 17, 2024 Elliott Wave Theorist: Record Sentiment Readings for Stocks Investors are enamored with stocks that pay little or nothing in the way of… Read more Another Extreme Sentiment in Stocks |
Printed Money Supply is Deflating
 |
This Trend Will Likely Soon Rock the U.S. Financial System Why monetary inflation has been shrinking Nearly everyone who buys groceries, fills their car tank with gas, pays rent, buys car insurance and so on is talking about the high cost of living. And it’s true that consumer price inflation is higher today than before… Read more Printed Money Supply is Deflating |
Non-Confirmation in Europe
 |
What You Can Learn from Europe’s “Dow Theory”-esque Non-confirmation By Brian Whitmer | European Financial Forecast editor Charles Dow (yes, the one with the averages named after him) developed a foundational concept in technical analysis that requires that price movement in industrial stocks and transportation shares confirm one another. The main condition for a Dow… Read more Non-Confirmation in Europe |
China-Taiwan Conflict
 |
Is a China-Taiwan Conflict Likely? Watch the Region’s Stock Market Indexes By Mark Galasiewski | Elliott Wave International The U.S. government in early May sanctioned 300 Chinese entities for supplying machine tools and parts to Russia for its war against Ukraine, while in mid-May Russian president Vladimir Putin made a two-day visit to China. In… Read more China-Taiwan Conflict |
Trouble Lies Ahead
 |
Trouble Lies Ahead. Are You Ready For It? By Steven Hochberg | Elliott Wave International Conversations about whether or not the Fed will cut interest rates any time soon continue to dominate the airwaves. But we are looking elsewhere for signs about where markets and the economy are headed. Having observed market behavior for 45… Read more Trouble Lies Ahead |
FED leads or follows the markets?
 |
The Fed Leads and the Market Follows? It’s a Big Fat MYTH We help investors by analyzing what really drives the markets. Along the way, we often uncover a market myth, something most investors believe moves the markets, but really doesn’t. I want to show you one of the biggest market myths in existence. It… Read more FED leads or follows the markets? |
Calm in the markets
 |
Stoxx Europe 600: What Signs of Investor Exuberance Keep Telling Us Every day, you read news stories about the state of the economy and the stock market affecting consumer and investor behavior. The story goes something like this: When the economy and financial markets show signs of improvement, consumers start to spend more, and investors… Read more Calm in the markets |
AI Revolution
 |
Global X Robotics & Artificial Intelligence ETF (BOTZ) looks like it is having a counter trend rally. This was foreseen as in the following article from Elliot Wave International back in March 2024: AI Revolution and NVDA: Why Tough Going May Be Ahead “These things could get more intelligent than us” The topic with all… Read more AI Revolution |
Another Bank Failure
 |
Another Bank Failure: How to Tell if Your Bank is At Risk Another bank failure, another underperforming share price. Philadelphia-based Republic First Bank was closed down on Friday, April 26, and the assets were sold to Fulton Bank. Republic First becomes the first bank failure of 2024. Given our outlook for the stock market and… Read more Another Bank Failure |
Time Tested Indicator
 |
Why You Should Pay Attention to This Time-Tested Indicator Now “How High Can Markets Go?” — asks this magazine cover Paul Montgomery’s Magazine Cover Indicator postulates that by the time a financial asset makes it to the cover of a well-known news weekly, the existing trend has been going on for so long that it’s… Read more Time Tested Indicator |
Bullish Buzz at Highest Level
 |
This “Bullish Buzz” Reaches Highest Level in 53 Years Learn what the AIM Index reveals By Elliott Wave International Yes, there’s been a recent pickup in stock market volatility, but overall, bullish sentiment remains very much alive and well. Indeed, here’s a Feb. 18 Yahoo! Finance headline: A Bull Market is Here. On April 9,… Read more Bullish Buzz at Highest Level |
Signs of Economic Slowdown
 |
3 Signs of Developing U.S. Economic Slowdown “Credit standards are tightening, thereby freezing out borrowers” Recent headlines about the U.S. economy are rosy: US economic growth for last quarter is revised up slightly to a healthy 3.4% annual rate (AP News, March 28) US economy continues to shine with help from consumers, labor market (Reuters,… Read more Signs of Economic Slowdown |
Gold Price Targets
 |
Gold: Setting Near-Term Price Targets This was our “initial upside target” — which has now been exceeded. What’s next? Around the first week of the year, the outlook for gold was not looking promising, at least according to this Jan. 5 headline (Reuters): Gold set for weekly decline as dollar, yields climb The rally in… Read more Gold Price Targets |
Insider Selling in Stocks
|
Stocks: What to Make of All This Insider Selling Here are details of “The Great Cash-Out” Corporate insiders may sell the shares of their company for any number of reasons but one of them is not because they think the price is going up. In other words, insider selling can serve as a warning. For… Read more Insider Selling in Stocks |
Extreme Greed in Stocks
 |
S&P 500: What to Make of Fear Versus Greed This sentiment index combines seven indicators into one useful trend measure That is — market participants generally go from feeling deeply pessimistic all the way to feeling highly optimistic — and then back again. These swings in investor psychology tend to produce similar circumstances at corresponding… Read more Extreme Greed in Stocks |
What the Fear Index VIX May be Saying
 |
What “Fear Index” VIX May Be Signaling “Note the succession of higher closing low relative to higher highs in…” First, just a quick basic fact about the CBOE Volatility Index (VIX) — also known as the stock market’s “fear gauge”: the lower the reading, the higher the complacency among investors. Higher readings indicate increased investor… Read more What the Fear Index VIX May be Saying |
China’s Housing Bust
 |
Here’s an Update on China’s Big Housing Bust “Property market weakness is now spreading into the overall economy.” If you’re wondering about the future value of your home or the housing market in general, you may want to pay attention to what’s going on in China. The bottom line: The way we see it at… Read more China’s Housing Bust |
Once in a Lifetime Debt Crisis
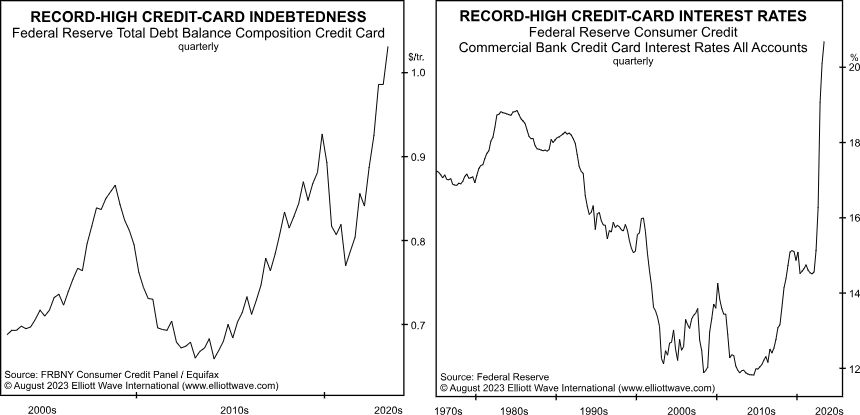 |
Why You Should Expect a Once-in-a-Lifetime Debt Crisis U.S. credit card debt surpasses $1 trillion On a national level, a debt crisis occurs when a country is unable to pay back its government debt. This might result from government spending exceeding tax revenues for an extended period. On an individual level, a crisis can result… Read more Once in a Lifetime Debt Crisis |
US Home Equity
|
What Will Happen to That $30 Trillion in U.S. Home Equity? “It’s like someone turned off the faucet” You probably remember the last big housing bust which began more than 15 years ago. Elliott Wave International has observed that falling housing prices are generally preceded by a decline in home sales. The lag time may… Read more US Home Equity |
Climbing Oil Prices
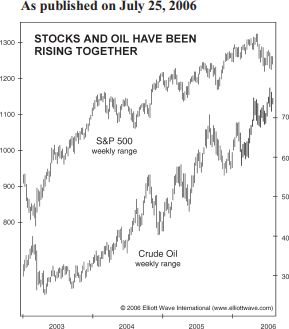 |
“Climbing Oil Prices Bearish for Stocks”? It’s a Myth! Oil and stocks sometimes trend together. Other times, they don’t. There’s a widespread belief that rising oil prices are bearish for the main stock indexes and falling oil prices are bullish for stocks. That belief is reflected in this Sept. 5 CNBC headline: Dow closes nearly… Read more Climbing Oil Prices |