Update: May 7th, 2022
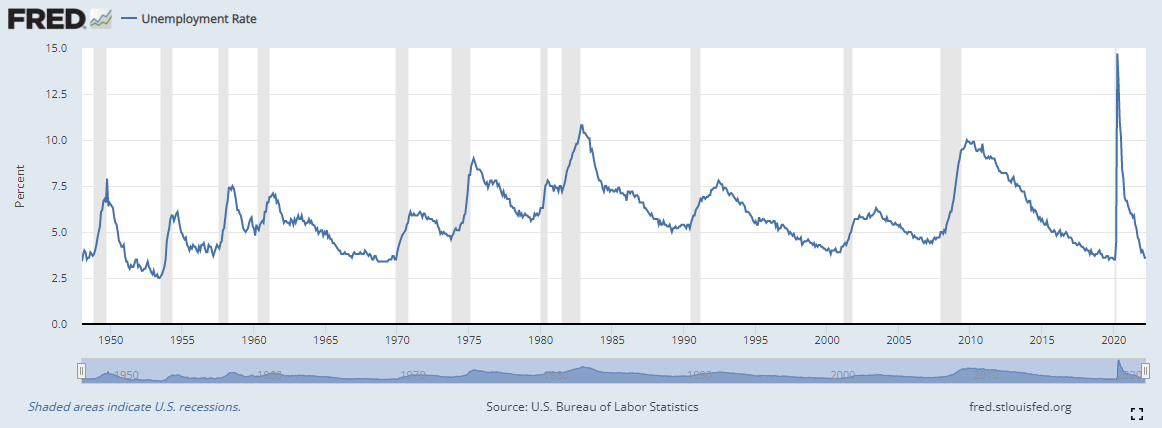
The Corona Virus pandemic skyrocketed the unemployment rate but the official FED numbers have since recovered:
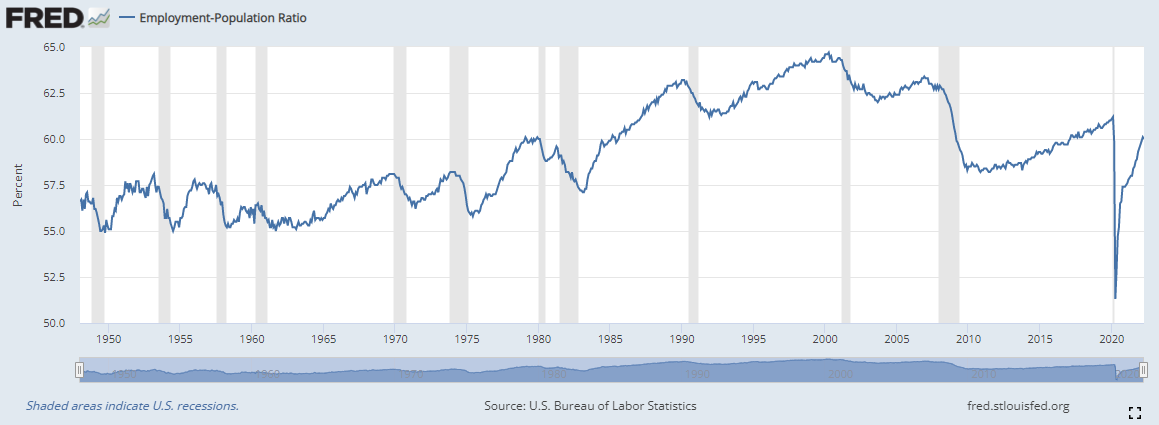
However, after the Greatest Bull Market during the last decade, the US employment ratio, the number of adults working, compared to the population is well below 2008 peak. As of May 2022, it is a disaster despite record money printing:
We have other problems that are hidden by the recent calamities. A reason why the jobs picture still looks gloomy is that an unusually high number of people can’t find jobs even though they have been looking for a long time. About 2.1 million Americans have been unable to get a job for over half a year. The government calls these people the “long-term unemployed.” We stop counting them.
The last big issue is that wages aren’t going up for many Americans. The typical take home pay (often called “median income” by the Census Bureau) is about the same today as it was 20 years ago, once you adjust for inflation.
Unemployment has increased steadily throughout the 2008 stock market crash and employment market never reached a peak throughout the stock market rally of 2009-2022. Causes of unemployment are many. But from a macroeconomic perspective, unemployment is a function of money supply. As the money supply deflates, unemployment increases. The FED has printed trillions. This has prevented deflation and it was possible as long as inflation has not appeared.
But in 2022, we do see persistent inflation and the FED has started to tighten the monetary policy to get inflation under control. While this is good news for the inflation problem we are facing, it can cause an increase in unemployment.
Why are you unemployed?
The Root Cause
Without the FED’s printer, there is not enough money in the economy to pay salaries that people HAVE TO demand. Why? Here is the bird’s eye explanation of the problem in our Debt Based Monetary System.
Banks create money when we borrow. Entire money supply is interest bearing debt. When we run out of borrowers, new money is not being created as fast anymore and we owe more than the entire money supply. This creates chronic shortage of money where weakest borrowers will go bankrupt.
Put in numbers, a gross simplification but makes the point clear: There are N people. Each borrowed X, but promised to pay X+I. So each must earn X+I. Who can pay that much? The combined money in the economy is N*X. How can we find employers who can pay N*(X+I) ? This is what they mean when they say one of the FED’s functions is to fight unemployment. They do that by keeping interest rates low (thereby making more people borrow which in turn increases the money supply), or they simply print money and lend to the US treasury who spends it (inflates the money supply) and creates jobs.
With the Covid pandemic, the FED has reduced the FED rate to 0%. This was an anomaly unseen in 2000 year human history before. FED has also printed trillions of dollars to keep the economy alive during covid shutdowns. We have reached better employment numbers with this flood of money. However, we have also maxed out our borrowing power. Everyone who could borrow has already done so. We have invested in homes and stocks with borrowed money.
What is next?
With the FED tightening monetary policy, borrowing will be reduced because at higher rates, less people will qualify or afford monthly interest payments. FED will also destroy previously printed money, at a rate of about 95 billion USD a month. This is a reversal of the last decade when FED has been printing almost full speed. This means there will at aggregate be less money to earn in the economy.
In theory an unemployed person could be willing to accept lower wages for work. But minimum wage laws do not allow that. Even if you wanted to work for less money, your employer cannot hire you because of the law. Then there are unions that tie the employers’ hands with regard to pay. But the bigger reason that really prevents you, or other debt slaves, from accepting lower wages is that the deflation of the money supply creates the conditions such that while the strong can earn, when they do so, not enough money is left for the weak. Thus there can not be enough jobs for everyone. This is a problem of Debt Based Monetary System when deflation hits.
To understand the deflation and its impact in Debt Based Monetary System, we recomment the excellent book Conquer the Crash.
Conquer the Crash
The deflationary crash was forecast in 2002 “Conquer the Crash” best seller. Conquer the Crash correctly predicted credit deflation, bailout schemes, banking and insurance company troubles, troubles with collateralized securities, derivatives, mortgage-backed securities, woes of Fannie Mae and Freddie Mac, real estate crash. Conquer the Crash foretold the inability of rating rervices to see the coming crash, fate of political leaders in bear markets, desire to print money, short-selling ban, and other psychological changes that accompany bear markets. Plunging confidence and crashing tax receipts were all predicted. Conquer the Crash is a must read to understand the severe economic downturn we are in. Even today, seemingly after the worst of it, the updated second edition is an entertaining read that explains the financial turmoil in a clear and easy to understand way to prepare you for what is about to come next. The 2020 edition of the book is still a must read to understand the economic challenges that the USA and the developed world faces under excessive debt pressure.