Update: May 7th, 2022
US home prices are at record highs and people are racing to buy homes as if their life depends on it. There is a FOMO – fear of missing out – to catch the low interest rates. The mania is recorded in the FED data:

Long term mortgage interest rate decline of the last 40 years has fueled the housing bubble:

This trend may now be reversing sharply as seen in the FED policy in early 2022, much faster than originally anticipated. The fast pace of change sets us for a housing market crash.
Don’t Fight the FED
The FED has two mandates: Inflation and Unemployment. The FED is not mandated to inflate housing or the stock market. They are not FED targets. They are tools for the FED to influence inflation and unemployment rate.
Inflation is here. The governments got more than what they wanted. We have inflation well above the 2% FED target. Now, the FED and the central banks around the world are planning to dial down the wealth effect. They will again use housing and stocks for this purpose, but in reverse. As the treasury, mortgage rates go up, so does the FED rate. This makes housing unaffordable at current prices.
When the 30 year mortgage rate goes from 3% to 6%, it is not a mere 3% increase on mortage. It doubles the monthly mortgage interest that a borrower is required to pay. Zillow, Better.com and other housing related companies are laying off staff. Mortgage business is drying up because at higher rates borrowers won’t qualify for loans at these prices.
Multiple factors are conspiring against the housing market and the economy in general:
1. Interest rates going up – causes credit deflation because borrowing slows down
2. FED tapering – Quantitative tapering
3. Slower borrowing means deflating money supply (FED wants this to contain inflation)
Mortgage rates
Mortgage rates are spiking in early 2022:

This reduces affordability in housing. You may think it is still low compared to the historical norm, however, home prices are much higher. In other words, for affordability to come back to the historical norm, at these rates, prices must come down to their historical norm, too.
Quantitative Tapering
The Fed’s asset holdings — mostly Treasuries and mortgage bonds backed by government agencies — more than doubled during the pandemic, to about $8.9 trillion from $4.2 trillion. That total kept rising until March, when the Fed completed a “taper” of those purchases. In the March meeting, the minutes of which were released in April, Fed officials discussed shrinking the balance sheet at a maximum monthly pace of $60 billion in Treasuries and $35 billion in mortgage-backed securities — in line with market expectations and nearly double the peak rate of $50 billion a month the last time the Fed trimmed its balance sheet from 2017 to 2019. Tapering is planned to start in June.
This reduces the money supply. It is the reverse of the FED printing money. This time, FED will be destroying the money that they have printed. This is deflationary. FED wants this to contain the inflation.
Slowdown in borrowing
Mortgage businesses are laying off because they see the writing on the wall. Borrowing is going to decrease due to higher rates because people won’t be able to afford the loans required to buy properties at the current rates.
This has broader ramifications in a Debt Based Monetary System:
For decades we have borrowed. In doing so we created the money supply for USD dollar. But we promised to pay back with interest. Thus the entire money supply is not enough to pay the debt.
People didn’t make contracts to buy homes or stocks or gold or bitcoin. They are not obligated to buy any of that. But entire population in a mania borrowed and promised to pay back US dollars. People will be required to find US dollars that does not exist. There is scarcity in US dollars. This is the mathematical truth. It cannot be paid without the FEDs printer. FED won’t print until the bubble they created is gone.
Given that money supply is P as in principal and total debt is P+I, if you earn principal + interest, only principal – interest will be left for Joe to earn. Thus there cannot be enough jobs for all borrowers to earn what they have to.
Thus, the weakest borrowers will go bust.
This sets the stage for a deflationary crash. Credit will deflate and it will impact credit dependent sectors such as housing. Inflation of milk price or gas price is irrelevant, or it has negative impact as it makes mortgage even more unaffordable for the average family budget.
Despite of more than decade of money printing, merely the talk of higher rates and quantitative tapering sent the US dollar index up:

To understand the credit deflation, Debt Based Monetary System, scarcity in US dollar and the FED, we recommend the book Conquer the Crash. You can start with the free chapters as an introduction to help you understand the upcoming crash that may dwarf anything we have seen in our lifetime.
Rising Mortgage Rates
This is “Anything but Positive for Housing”
Has the rise in mortgage rates only begun?
A tug-of-war between bullish and bearish forces appears to be playing out in the U.S. housing market.
On the one hand, some areas of the country are still experiencing record-high home prices as buyers outnumber sellers.
On the other, the number of home sellers who dropped their asking price spiked to a six-month high of 15% during a four-week period ending on May 1, according to a Redfin report released on May 6.
Another development that falls in the bearish category for residential real estate is rising mortgage rates.
Here’s what the April Elliott Wave Financial Forecast, a monthly publication which provides analysis of major U.S. financial markets, noted as it showed this chart:

The rising interest-rate story is anything but positive for housing. This chart shows a surge in the cost of financing a home. Over the last 15 months, the Freddie Mac 30-year mortgage rate rose from a record low 2.65% to 4.67%, a 76% increase. … As the chart title suggests, mortgage rates have much higher to go.
In fact, about a month after that commentary published, a May 9 Fox Business news item said:
The 30-year fixed-rate mortgage surged to 5.27% annual percentage rate (APR) for the week ending May 5, 2022, according to Freddie Mac. …
That’s the highest 30-year fixed mortgage rate since 2009.
As the Campbell Real Estate Timing Letter noted (May 15):
In April 2022, a $1,000 principal and interest mortgage payment currently affords a loan that is 30% smaller than at the beginning of 2021.
Now, let’s mention another bearish factor for U.S. housing — and that’s the action of the stock market.
You see, the stock and real estate markets tend to be highly correlated. They may not be in perfect synchronization, but generally, they both tend to rise and fall together.
And, as you probably know, the Dow Industrials and S&P 500 index have been in a downtrend since January.
Now is the time to pay close attention to the Elliott wave structure of the stock market, which, as mentioned, can help you get a handle on the housing market.
If you need a refresher on Elliott wave analysis, or are entirely new to the topic, you are encouraged to read Frost & Prechter’s Wall Street classic, Elliott Wave Principle: Key to Market Behavior. Here’s a quote from the book:
In the 1930s, Ralph Nelson Elliott discovered that stock market prices trend and reverse in recognizable patterns. The patterns he discerned are repetitive in form but not necessarily in time or amplitude. Elliott isolated five such patterns, or “waves,” that recur in market price data. He named, defined and illustrated these patterns and their variations. He then described how they link together to form larger versions of themselves, how they in turn link to form the same patterns of the next larger size, and so on, producing a structured progression. He called this phenomenon The Wave Principle.
Although it is the best forecasting tool in existence, the Wave Principle is not primarily a forecasting tool; it is a detailed description of how markets behave. Nevertheless, that description does impart an immense amount of knowledge about the market’s position within the behavioral continuum and therefore about its probable ensuing path. The primary value of the Wave Principle is that it provides a context for market analysis.
You can learn more about the Wave Principle by reading the entire online version of the book for free!
All that’s required for free access is a Club EWI membership.
Club EWI is the world’s largest Elliott wave educational community and is free to join.
You may be interested in knowing that Club EWI members enjoy complimentary access to a wealth of Elliott wave resources on investing and trading with zero obligations.
Just follow this link to get started: Elliott Wave Principle: Key to Market Behavior — free, unlimited and instant access.
Is the Bubble About to Pop?
Record low interest rates have pushed home prices to new highs in many markets. But will the Housing Bubble pop again?
This chart from Robert Prechter’s 2020 edition of Conquer the Crash has been shown before in these pages, and it’s a good time to show it again. Here’s the brief commentary:
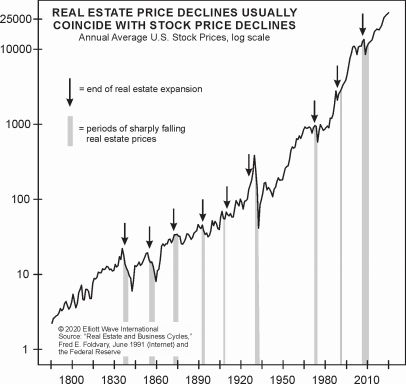
Real estate prices have always fallen hard when stock prices have fallen hard. The chart displays this reliable relationship.
If you want to get a good idea of when home prices will likely tumble, keep an eye on the Elliott wave pattern of the stock market.
Get started by following this link: Elliott Wave Principle: Key to Market Behavior — free and unlimited access.
Why did the government subsidize housing?
When we borrow money, banks create brand new money. They do not lend existing money. Here is how banks create money.
This flood of money makes the current administration look good. Keep in mind, if the FED is not aligned with the US government, they can adopt reverse policies to make the administration look bad.
Remember all the talk about “Affordable Housing”? And right after the government promised American dream come true, they made mortgage easy, and propelled the home prices. That is not really affordable housing. When the home prices are came down in 2008-2011, instead of celebrating that home prices are affordable they adopted low interest rate policies to propel them up again. This is because Uncle Sam wants you to borrow money so that banks create money! As simple as that. The more you borrow, the better it is. This is the only tool that the government has to make it look like they are doing good.
FED has kicked the can down the road as far as they could. Now the road has ended. Inflation has shown its ugly head. Now FED wants to tigthen. This tightening will be felt across the industries, but mostly in housing as the wealth effect is dialed back.
Click here for a free report on how to survive deflation and another one about the deflationary pressures we are facing.