 |
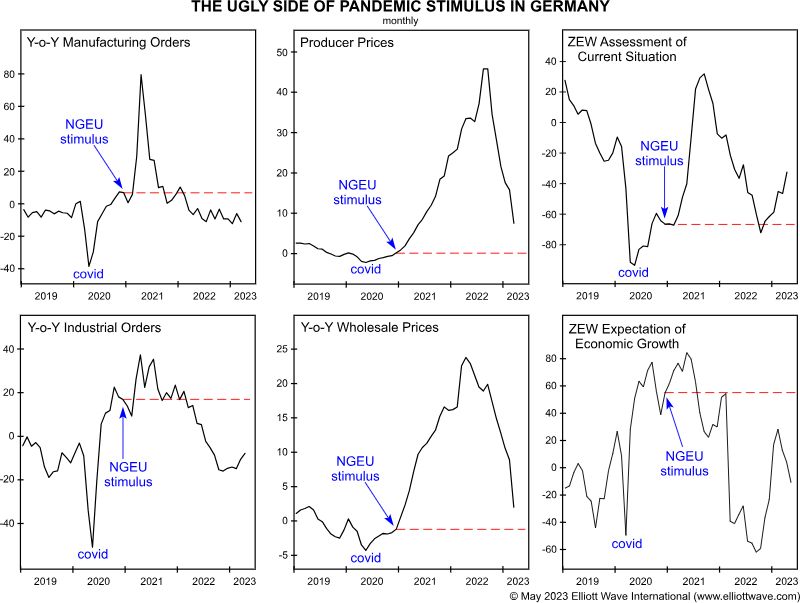
How Germany’s Economy is Turning Ugly This economic gauge “dipped back below zero in less than a year” In November 2020, when fears were rampant over a second wave of the coronavirus pandemic, the president of the European Central Bank called for economic stimulus (Reuters): Facing gloomy outlook, Lagarde calls for unlocking EU aid In… Read more German Economy is Broken |
Tulip Mania Was Nothing
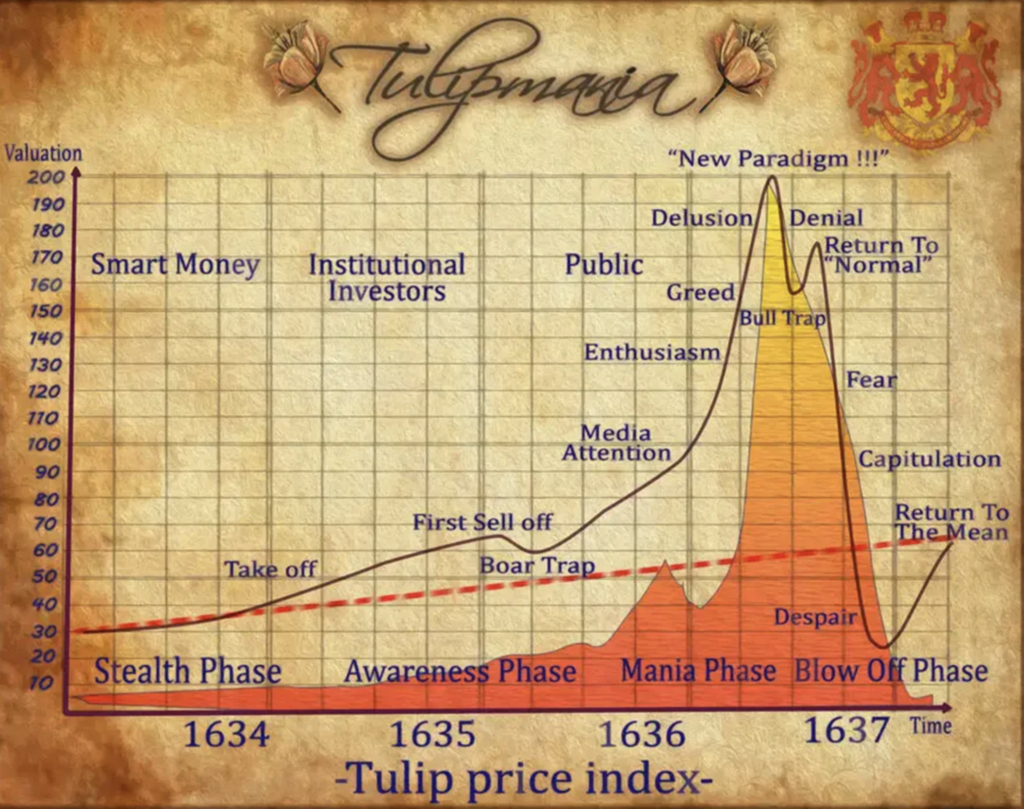 |
Recently, Elliott Wave International’s president Robert Prechter gave a rare interview. He covered a lot of ground – from stocks and Bitcoin to the economy and gold. Our friends at Elliott Wave International are sharing Prechter’s interview with you free. Listen as Prechter explains why 2021’s extreme market sentiment made the Tulip Mania look like… Read more Tulip Mania Was Nothing |
Divergence in Stocks vs Junk Bonds
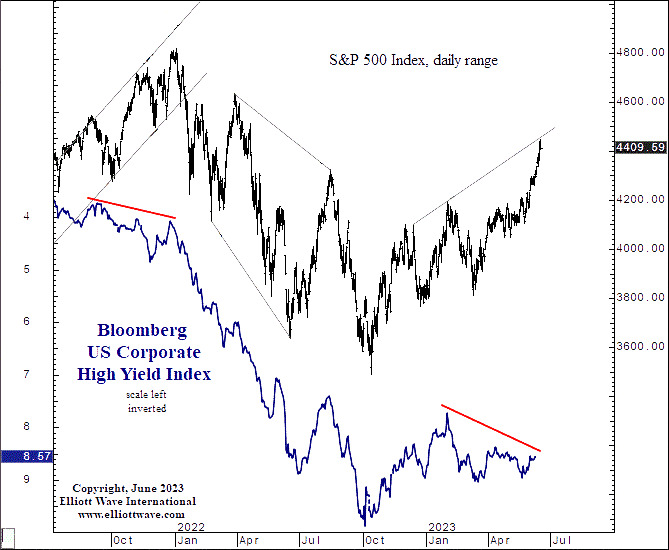 |
Stocks and Junk Bonds: “This Divergence Appears Meaningful” “Everything was aligned until February 2” The trends of the junk bond and stock markets tend to be correlated. The reason why is that junk bonds and stocks are closely affiliated in the pecking order of creditors in case of default. The rank of junk bonds is… Read more Divergence in Stocks vs Junk Bonds |
Harbinger of the Bear Market
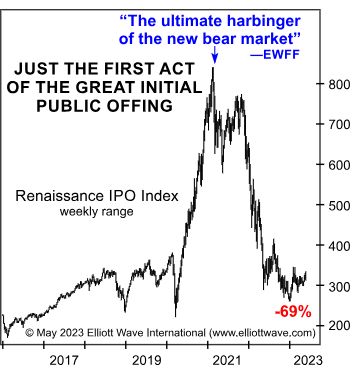 |
Insights into This “Ultimate Harbinger” of the Bear Market Enthusiasm for U.S. IPOs seems to be dramatically decreasing Back in early 2021, many investors were chomping at the bits to invest in entities about which they knew next to nothing. These entities are known as Special Purpose Acquisition Companies (SPACs), which may be described as… Read more Harbinger of the Bear Market |
Possible Replay of History
 |
Stocks: Possible Replay of an Ominous Price Pattern “I became panicky and covered at a considerable loss…” The reason price patterns tend to repeat in the stock market is that investor psychology never changes. The Elliott wave model directly reflects these largely predictable swings in investor psychology. That’s what the Elliott wave principle is all… Read more Possible Replay of History |
Sectors Leading Lower
 |
Will These 2 Sectors Lead the Stock Market Lower? This key sector continues to be “fragile” Although it doesn’t feel like it sometimes, the U.S. stock market has been in a downtrend since January 2022. The reason it doesn’t feel like it is because the S&P 500 has been in a narrow trading range between… Read more Sectors Leading Lower |
More Banks Could Fail
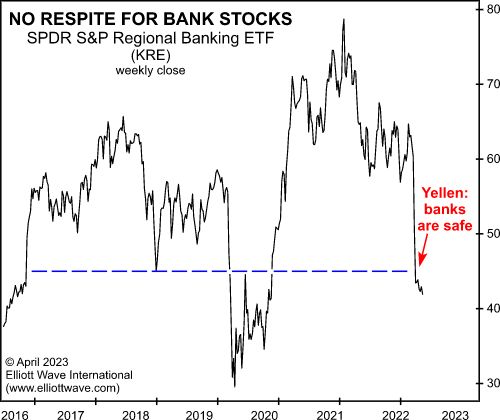 |
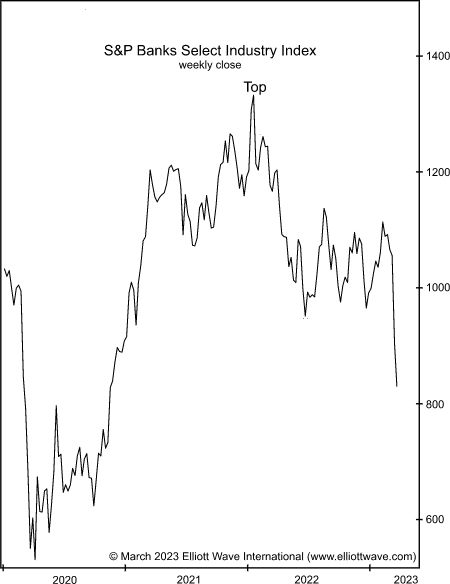
More Banks Could Collapse — A Lot More This ETF “continues to make lower lows” It’s sobering to reflect on the fact that the second, third and fourth largest bank failures in U.S. history have all occurred in just the past few months. They are First Republic, Silicon Valley Bank and Signature Bank of New… Read more More Banks Could Fail |
Insane Optimism in Stocks
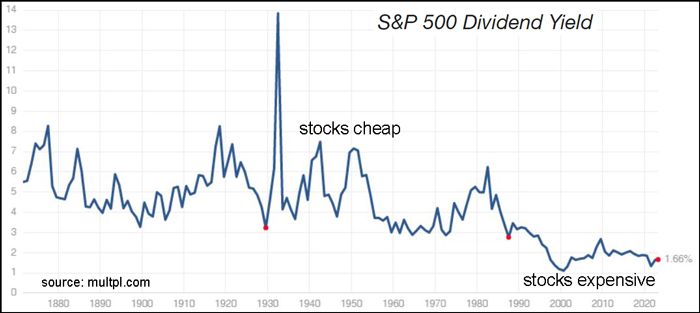 |
How “Insane Optimism” is at Work in the Stock Market “Stock investors are so bullish that they are…” Many technical indicators are highly useful, yet the price moves of the stock market really boil down to two things: optimism and pessimism. Major trend turns tend to occur when extremes are reached in either optimism or… Read more Insane Optimism in Stocks |
Next Shoe to Drop: Corporate Bonds
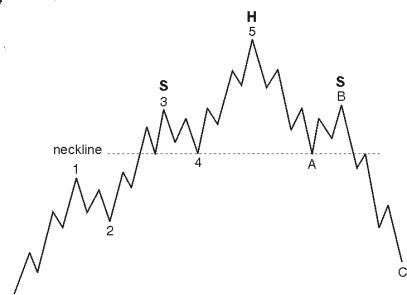 |
Corporate Bonds: “The Next Shoe to Drop” “The neckline has been broken over the last few days” A “calamity” is likely ahead for corporate bonds, says our head of global research, Murray Gunn. Some of Murray’s analysis involves the head and shoulders, a classic technical chart pattern. In case you’re unfamiliar with it, here’s an… Read more Next Shoe to Drop: Corporate Bonds |
Credit Default Swaps Provide Warning
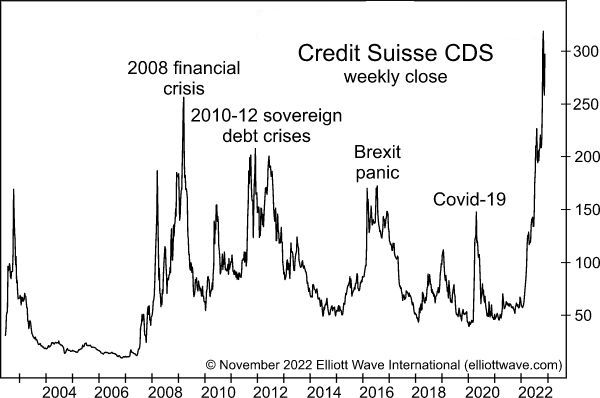 |
Credit Suisse: How the Price of Credit-Default Swaps Provided a Warning “… exceeded every high-water mark … of the past 15 years” Credit-default swaps were invented in the mid-1990s but a lot of people did not become aware of them until around 2000, and that awareness increased dramatically during the 2008 financial crisis. As you… Read more Credit Default Swaps Provide Warning |
M2 Money Supply Deflates
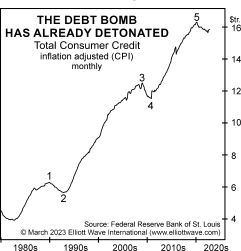 |
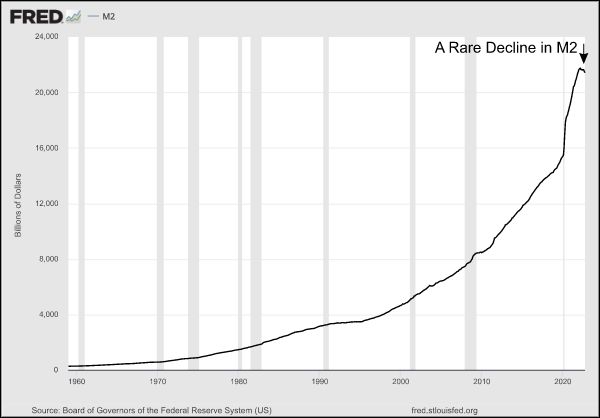
U.S. Money Supply Deflates 2% Annually (What That Means) The debt bomb implodes: Expect recession and deflation Many pundits have expressed worry about the ramifications of global debt — and rightly so. As the Wall Street Journal noted toward the end of 2022: The world has amassed $290 trillion of debt and it’s getting more… Read more M2 Money Supply Deflates |
Rise in Stock Market Volatility Ahead
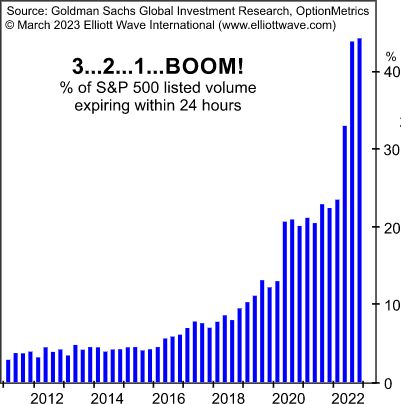 |
Explosive Rise in Stock Market Volatility! Why It May Be Ahead There are now S&P options that expire each day of the week. What that may mean. Here’s a Wall Street Journal headline from a couple of months ago that some people may have scanned without much contemplation (Jan. 11): VIX, Wall Street’s Fear Gauge,… Read more Rise in Stock Market Volatility Ahead |
Housing Market Top
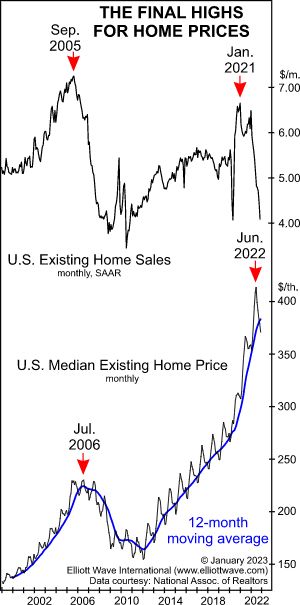 |
How This Pattern from the Prior Housing Bust is Repeating Here’s when homes will likely sell for once-in-a-lifetime bargains Just like the gold “in them thar hills” motivated people from all walks of life to become miners way back when, real estate booms have motivated people from far and wide to become agents. In both… Read more Housing Market Top |
Retail Investors Jump In
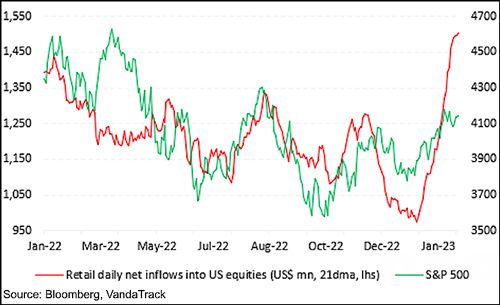 |
U.S. Stocks: Why Acting Independently Has Never Been More Important “Individual investors have been snapping up stocks at the fastest pace on record” More than 20 years ago, when I was working for another company, I remember hearing a colleague say that he doesn’t look at his monthly 401k statements. The implication was clear: He… Read more Retail Investors Jump In |
Recession Consensus Might Be Too Optimistic
 |
Why the Recession Consensus Might Be Too Optimistic “Major stock market declines lead directly to…” The verdict seems to be in: The economy is headed for a recession. These headlines from the past few months show what I’m talking about: A 2023 recession would mean job losses for most industries … (USA Today, Feb. 3)… Read more Recession Consensus Might Be Too Optimistic |
Gold Price and Inflation
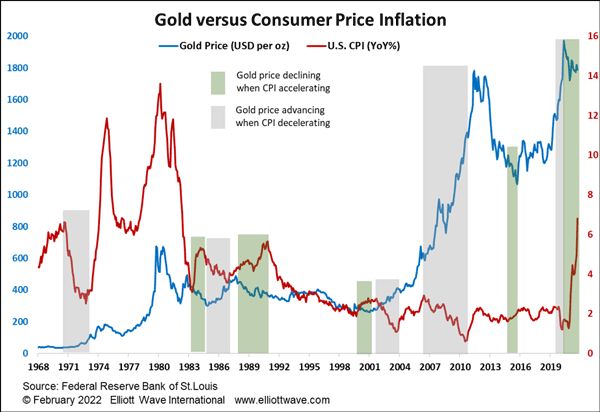 |
Gold and Inflation: Here’s a Market Myth “If you believe in Gold as a consumer price inflation hedge then…” Back in the days of the Roman Empire, an ounce of gold could buy a Roman a well-made toga, belt and finely crafted sandals. In modern day Rome, lo and behold, a businessman can become sharply… Read more Gold Price and Inflation |
Why Oil Prices Fell Despite Supply Shock
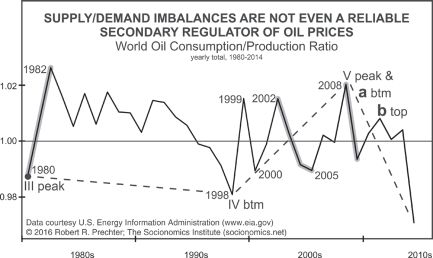 |
Why Oil Prices Fell in the Face of “Supply Shock” “Crude should be at the forefront of a…” Looking back on 2022, one of the biggest fears about oil was that prices would skyrocket even more than they did due to a disruption in supply from Russia. Of course, Russia has been a major world… Read more Why Oil Prices Fell Despite Supply Shock |
Deflation Threat
 |
Why the Threat of Deflation is Real “The Federal Reserve is forging ahead with its balance sheet reduction” I know — inflation has been grabbing all the headlines for a good while now — so you may wonder why the subject of deflation is relevant. First, the definitions of inflation and deflation go beyond commonly… Read more Deflation Threat |
FED Follows Treasury Rates Again
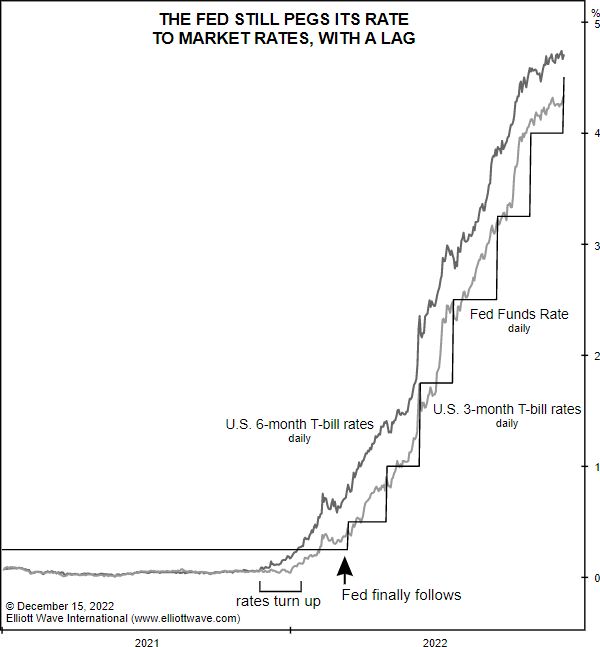 |
Major Fed Myth: Debunked The Fed is reactive in setting rates – not proactive The days of near-zero interest rates are long gone — at least for now. As we look back on 2022, we know that it’s been a year of rising interest rates, and many observers say it’s all due to the Fed.… Read more FED Follows Treasury Rates Again |
2022 May Have Been the Preview of the Upcoming Crash
 |
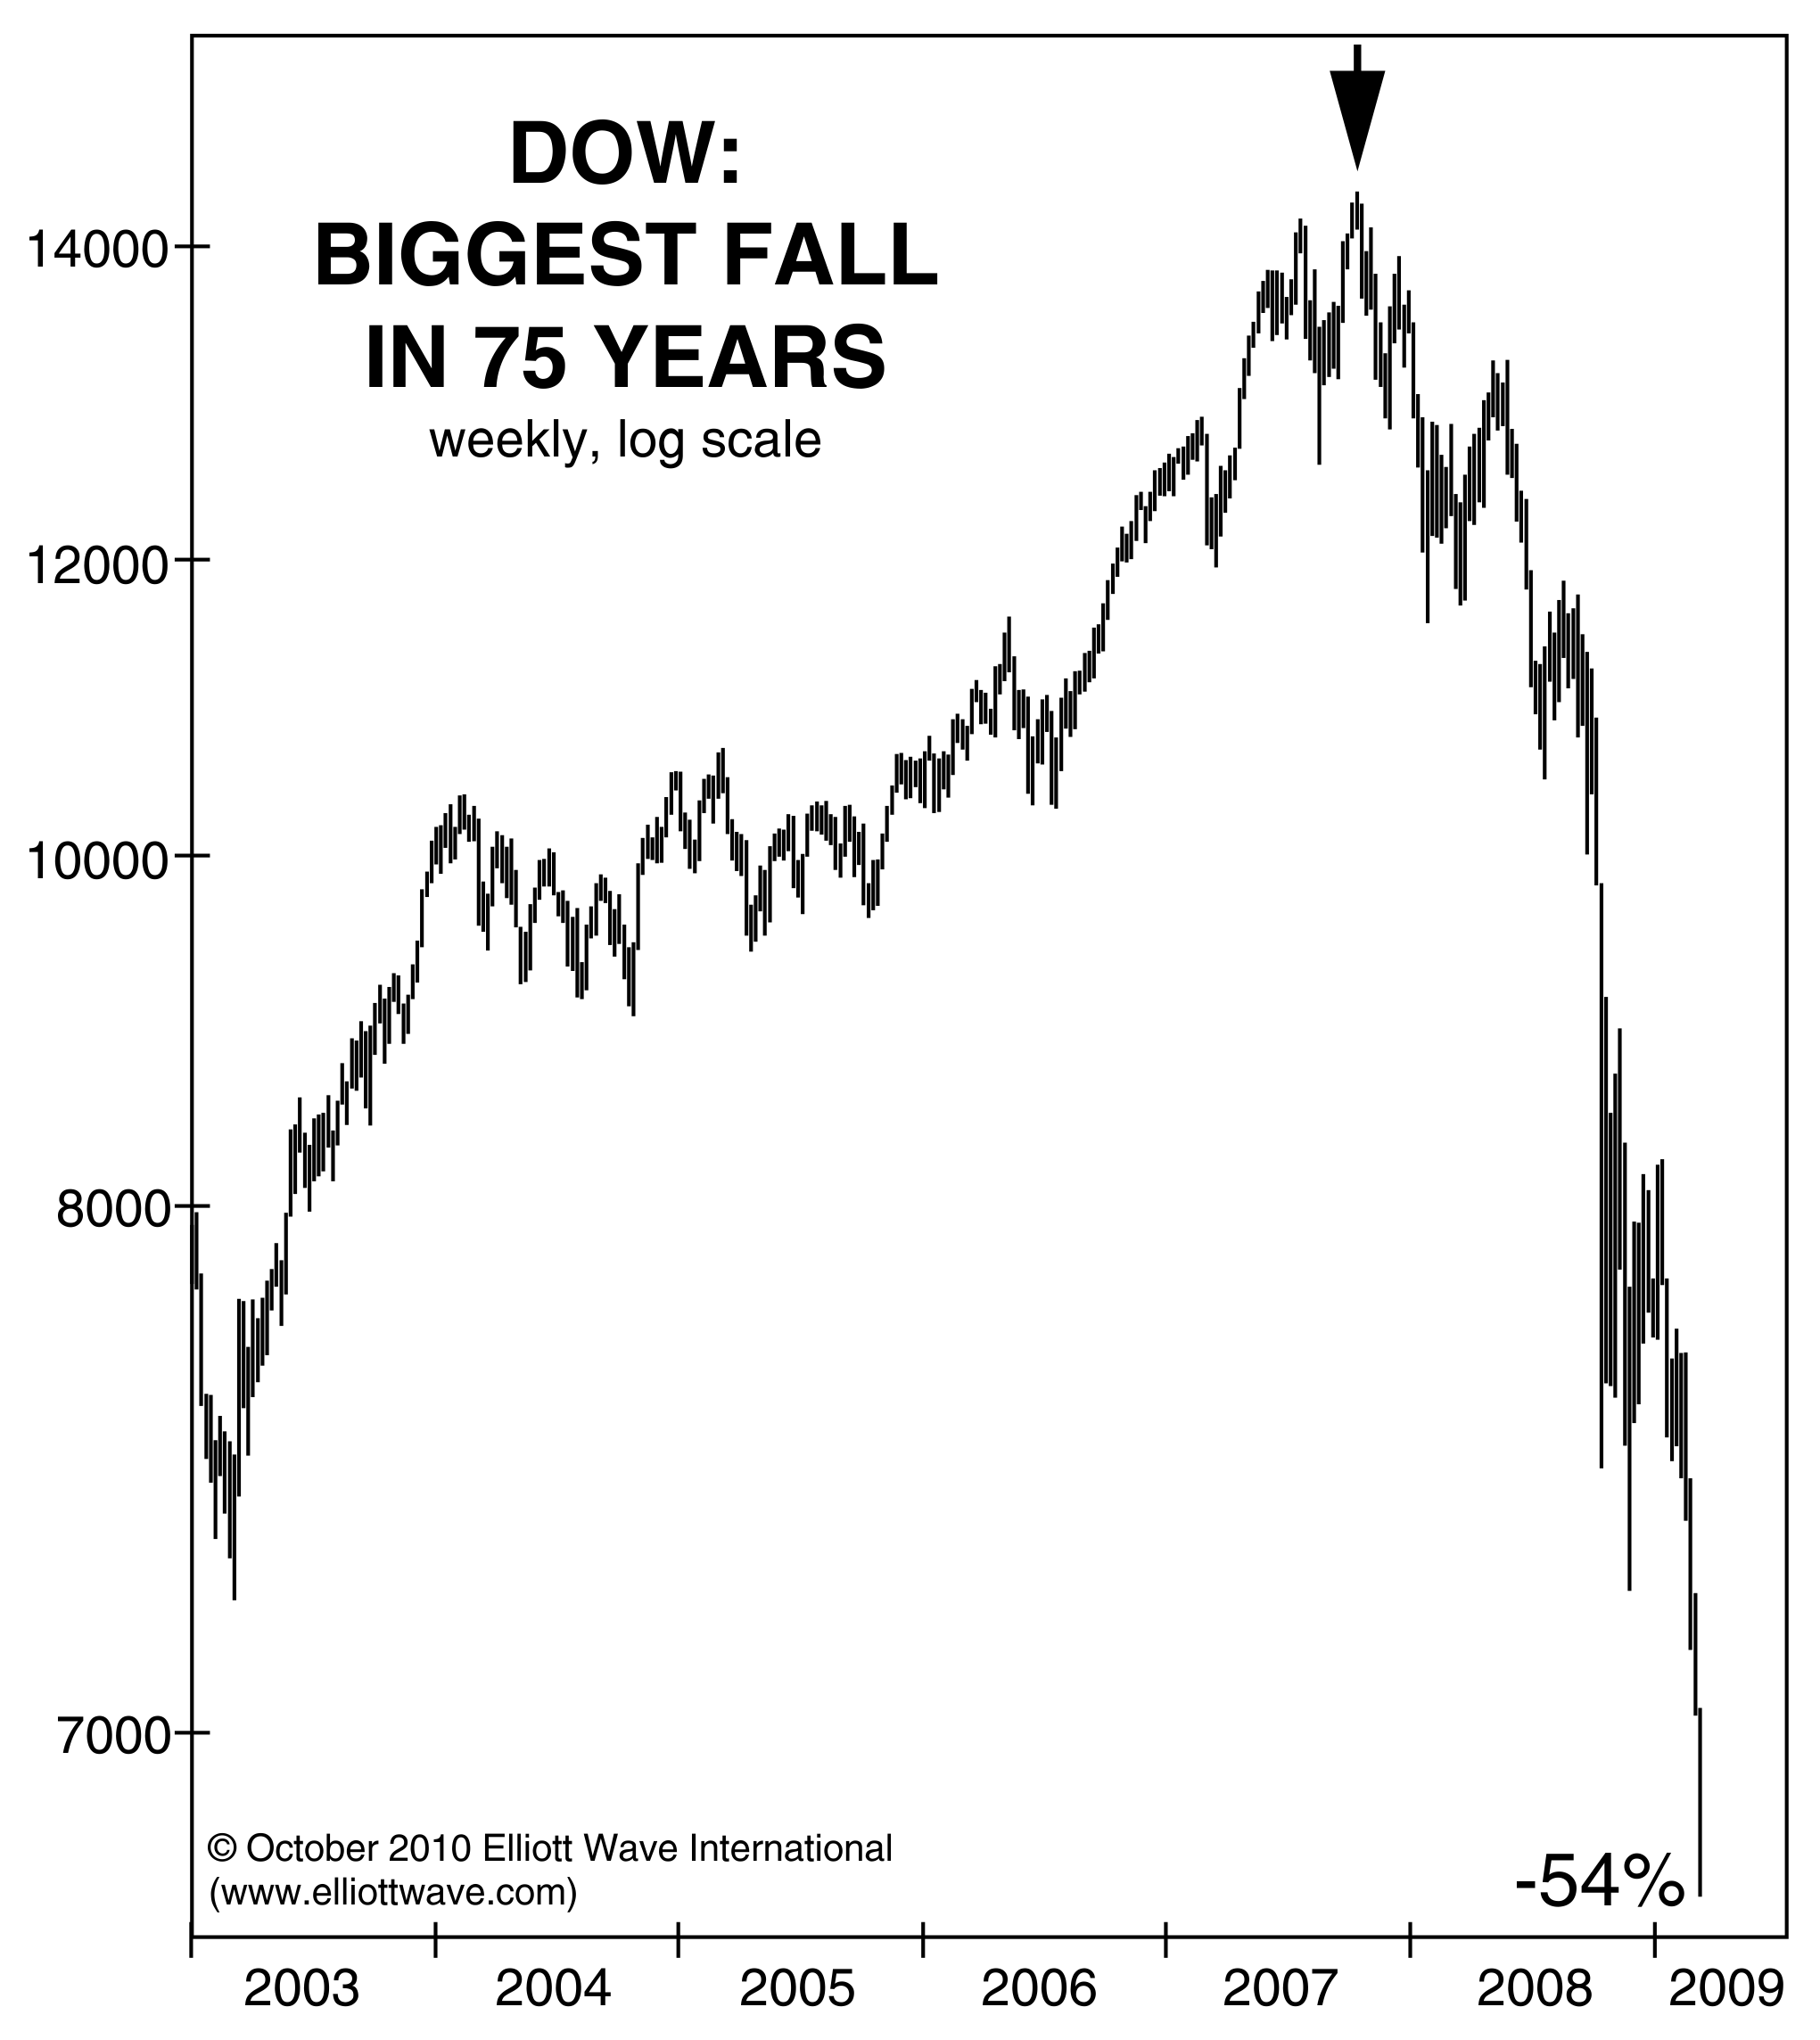
Stocks and Economy: Why 2022 May Have Just Been the Preview “Fight the inertia that will keep you from taking action to prepare for the downturn” The main show is likely about to begin. 2022 may have just been a preview of what’s ahead for stocks and the economy, which Robert Prechter’s Last Chance to… Read more 2022 May Have Been the Preview of the Upcoming Crash |