Gold and Silver: Pay Attention to This Noteworthy Record High
Here’s what usually occurs in related financial markets when “big changes in social mood are afoot”
Related financial markets tend to move together. For example, gold and silver.
Or, consider stocks. When the Dow Industrials are up on a given trading day, the NASDAQ is usually in the green too. The same applies when the Dow is down. Other major stock indexes tend to close in negative territory as well.
However, when a trend is near exhaustion — whether bullish or bearish — “non-confirmations” often happen. A non-confirmation occurs when one market makes a new high (or low), but a related market does not.
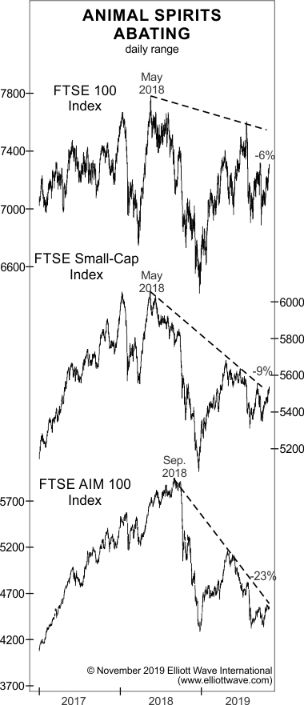
Let’s stick with the example of stocks as we look at this chart and commentary from Elliott Wave International’s November 2019 Global Market Perspective:

Notice that while the FTSE 100 is off 6% since its May 2018 high, the Small-Cap index and the AIM 100 are down 9% and 23%, respectively. These non-confirmations are important, because markets almost always splinter when big changes in social mood are afoot. … It’s only a matter of time before the broad indexes abandon the bull-market party.
As we all know, abandon it they did — in a very dramatic way.
Now, let’s look at what’s going on with gold and silver.
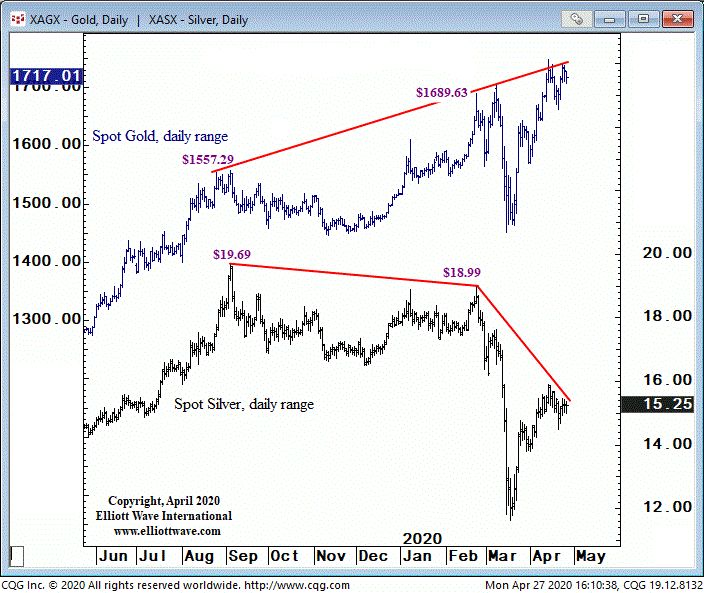
Here’s a chart and commentary from EWI’s April 27, 2020 U.S. Short Term Update:

Gold is massively overvalued relative to physical commodities and the ratio of gold-to-silver recently jumped to a record high. There remains a large non-confirmation between gold and silver.
Even so, here’s an April 21 headline (CNBC):
Bank of America raises gold forecast by a whopping $1,000 to $3,000 because of zero rates
Well, this major bank’s outlook for gold might turn out to be correct.
On the other hand, it’s obvious — as you’ve just seen — that the gold and silver markets are significantly splintered.
Plus, the Elliott wave model is also providing clues about the next big moves in the gold and silver markets.
And, speaking of Elliott wave analysis, EWI has just made available a 1-hour course titled: The Wave Principle Applied. You can access this valuable resource 100% free through May 15, 2020.
How?
Simply join Club EWI. Membership is also free.
When you avail yourself of The Wave Principle Applied, you will learn how to spot Elliott wave patterns on a price chart. Plus, you’ll acquire trading insights.
As Frost & Prechter’s Elliott Wave Principle: Key to Market Behavior noted:
After you have acquired an Elliott “touch,” it will be forever with you, just as a child who learns to ride a bicycle never forgets. Thereafter, catching a turn becomes a fairly common experience and not really too difficult. Furthermore, by giving you a feeling of confidence as to where you are in the progress of the market, a knowledge of Elliott can prepare you psychologically for the fluctuating nature of price movement and free you from sharing the widely practiced analytical error of forever projecting today’s trends linearly into the future. Most important, the Wave Principle often indicates in advance the relative magnitude of the next period of market progress or regress.
Simply follow the link for your free membership into Club EWI, and then you can access The Wave Principle Applied — 100% free — through May 15 (EWI normally sells the course for $99).