The U.S. faces the prospect of a Japan-like deflation.
Let’s begin with a brief review of Japan.
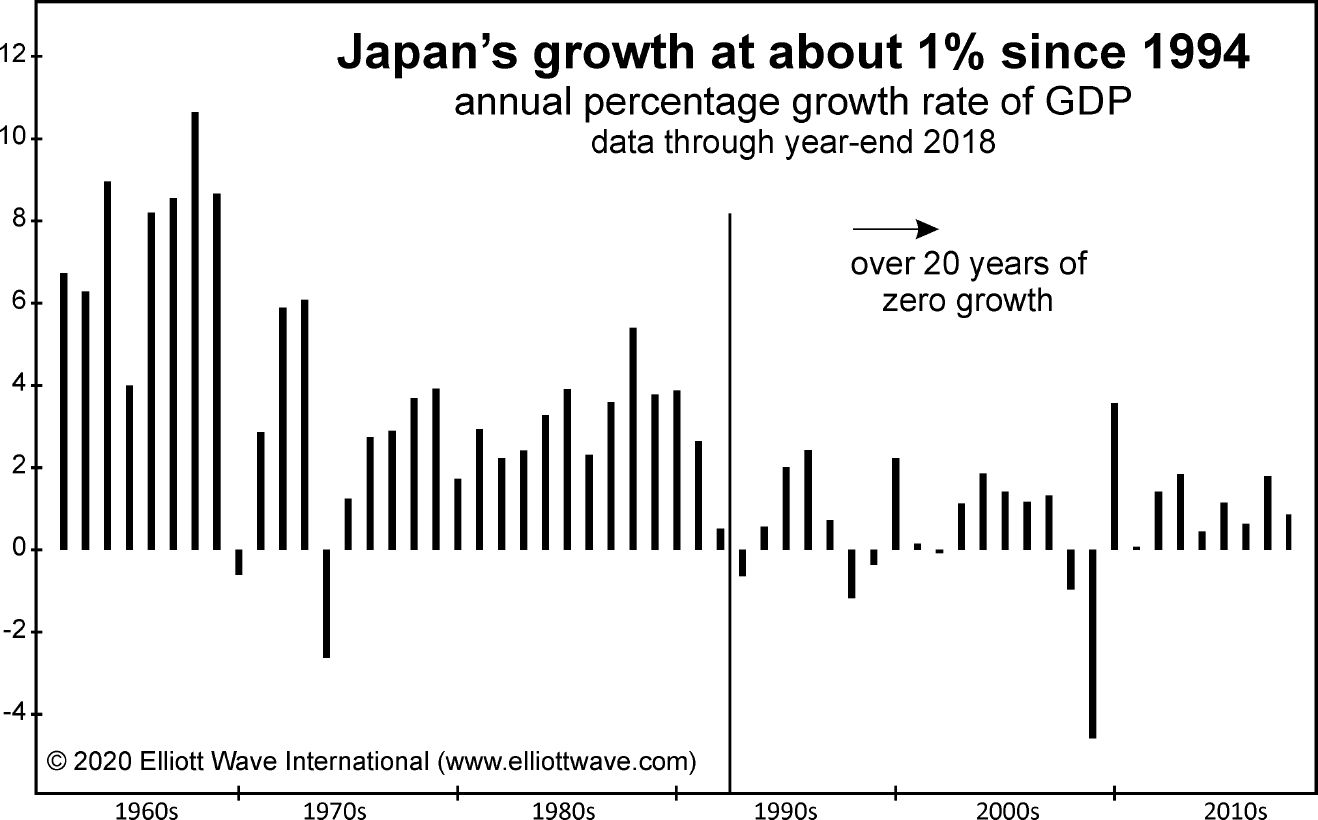
Here’s a chart and commentary from the 2020 edition of Robert Prechter’s Conquer the Crash:

Japan had one of the strongest economies in the entire world, growing at a 9% rate for 20 years up to 1973, and then a pretty strong rate of about 4.5% through 1994. From there, it’;s averaged about 1%. …
Economic growth in the United States today is weaker than Japan’s was in 1989 when its bull market ended. The U.S. economy is dramatically weak relative to the amount of central-bank inflating.
Speaking of the U.S., here’s a May 18 headline and sub-headline from Bloomberg:
America Is Becoming Japan, Not in a Good Way
The country could be on the brink of its own deflationary era.
Bloomberg referred to this prospect as the “Japanification” of the U.S.
But, getting back to that phrase “deflationary era” – what would that look like? What is deflation?
Well, many people erroneously believe that deflation simply means “falling prices.” Yet, it goes well beyond that.
Let’s return to the 2020 edition of Conquer the Crash for a fuller explanation:
A deflationary crash is characterized in part by a persistent, sustained, deep, general decline in people’s desire and ability to lend and borrow. A depression is characterized in part by a persistent, sustained, deep, general decline in production. … Because both credit and production support prices for financial assets, their prices fall in a deflationary depression. As asset prices fall, people lose wealth, which reduces their ability to offer credit, service debt and support production.
Well, the U.S. has already experienced falling asset prices. Consider oil and other commodities, as well as the stock market – which, despite the recent rally, is still well off the highs.
Plus, and most importantly, there’s been a credit market contraction and slackening production.
In April, manufacturing output declined 6.3%, according to the Federal Reserve. Moreover, industrial production dropped 5.4% and Q1 GDP fell 4.6%. The Q2 GDP number could show a much bigger drop. Current estimates range from a decline of 25% to 40%.
Also in April, the Credit Managers’ Index from the National Association of Credit Management slid 8.3 points. That’s after a drop of 7.2 in March.
Other deflationary pressures are also in place. As examples, producer prices have been sluggish, and according to the Atlanta Fed’s U.S. wage growth tracker, wage growth peaked at 3.9% in July 2019 and fell to 3.3% in April 2020.
There’s only been two major deflationary depressions in U.S. history. The first one extended from 1835 to 1843. The second one – known as “The Great Depression” – followed the 1929 stock market crash and stretched into 1933.
As you may know, other nations also suffered through the Great Depression.
Is another deflationary depression on our doorstep?
Get a 2020 Foresight and learn about 5 Market Trends 99% of Investors Will Miss, which is a 1-week, 5-insight series pulled directly from our flagship Financial Forecast Service.
It’s premium, subscriber-level content — 100% free to you when you join Club EWI. Membership is also free.
You get our latest forecasts for U.S. stocks, the economy, gold and more.
Follow this link now — 2020 Foresight: 5 Market Trends 99% of Investors Will Miss.