Are stocks overvalued? A quick look at the long term perspective.
Take a minute and look at a valuation chart for the stock market:
What we have here on the X axis is the bond yield/stock yield ratio for the S&P 400 companies. Sounds fancy, but all it means is that the further you go out to the right, the less companies are paying in dividends compared to what they are paying on their IOUs on their bonds. On the Y axis we have stock prices relative to book value. Book value is roughly equivalent to liquidation value, in other words, if you went and sold all the assets on the open market. When stocks get expensive, prices tend to rise relative to book value, and dividends tend to fall relative to the cost of borrowing. Why does that happen? At such times, people don’t really care about dividends because they think they are going to get rich on capital gains. So dividend payout falls, and stocks get more expensive.
The small square boxes indicate year-end figures. The large box is a general area that has contained values for the stock market for most of the years of the 20th century. We had a few outliers: 1928 and August 1987, which preceded crashes in the stock market. And of course stocks were really cheap in the early ’30s and again in 1941. If you are really astute, you have noticed something about this chart, which is that I’ve left off some of the data. It ends in 1990. What happened in the past two decades? Now I’m going to show you same chart but with the data from the last two decades on it. The March 2000 reading we call Pluto. Real estate wasn’t so bad; I think it only got to about Neptune. But the stock market reached Pluto in March of 2000 in terms of the bond yield/stock yield ratio and the price multiple of the underlying values of companies. And how are we doing now?
Check out the 2019 extreme valuation:
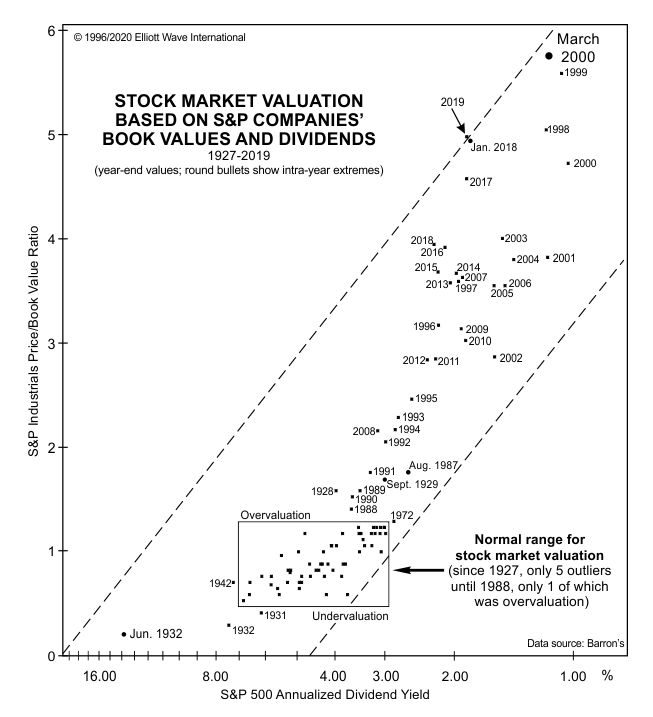
Every major peak since the early 20th century landed well outside the normal range: 1929, 1987, 2000, and 2007.
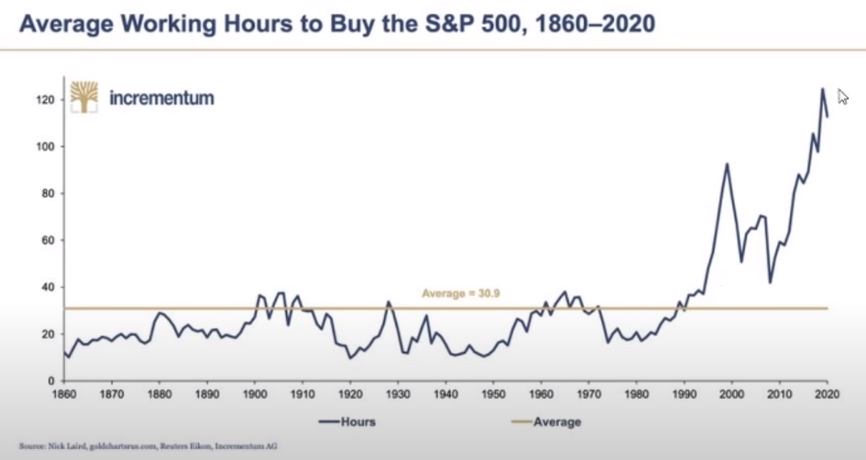
Average number of hours worked to buy S&P 500 peaks
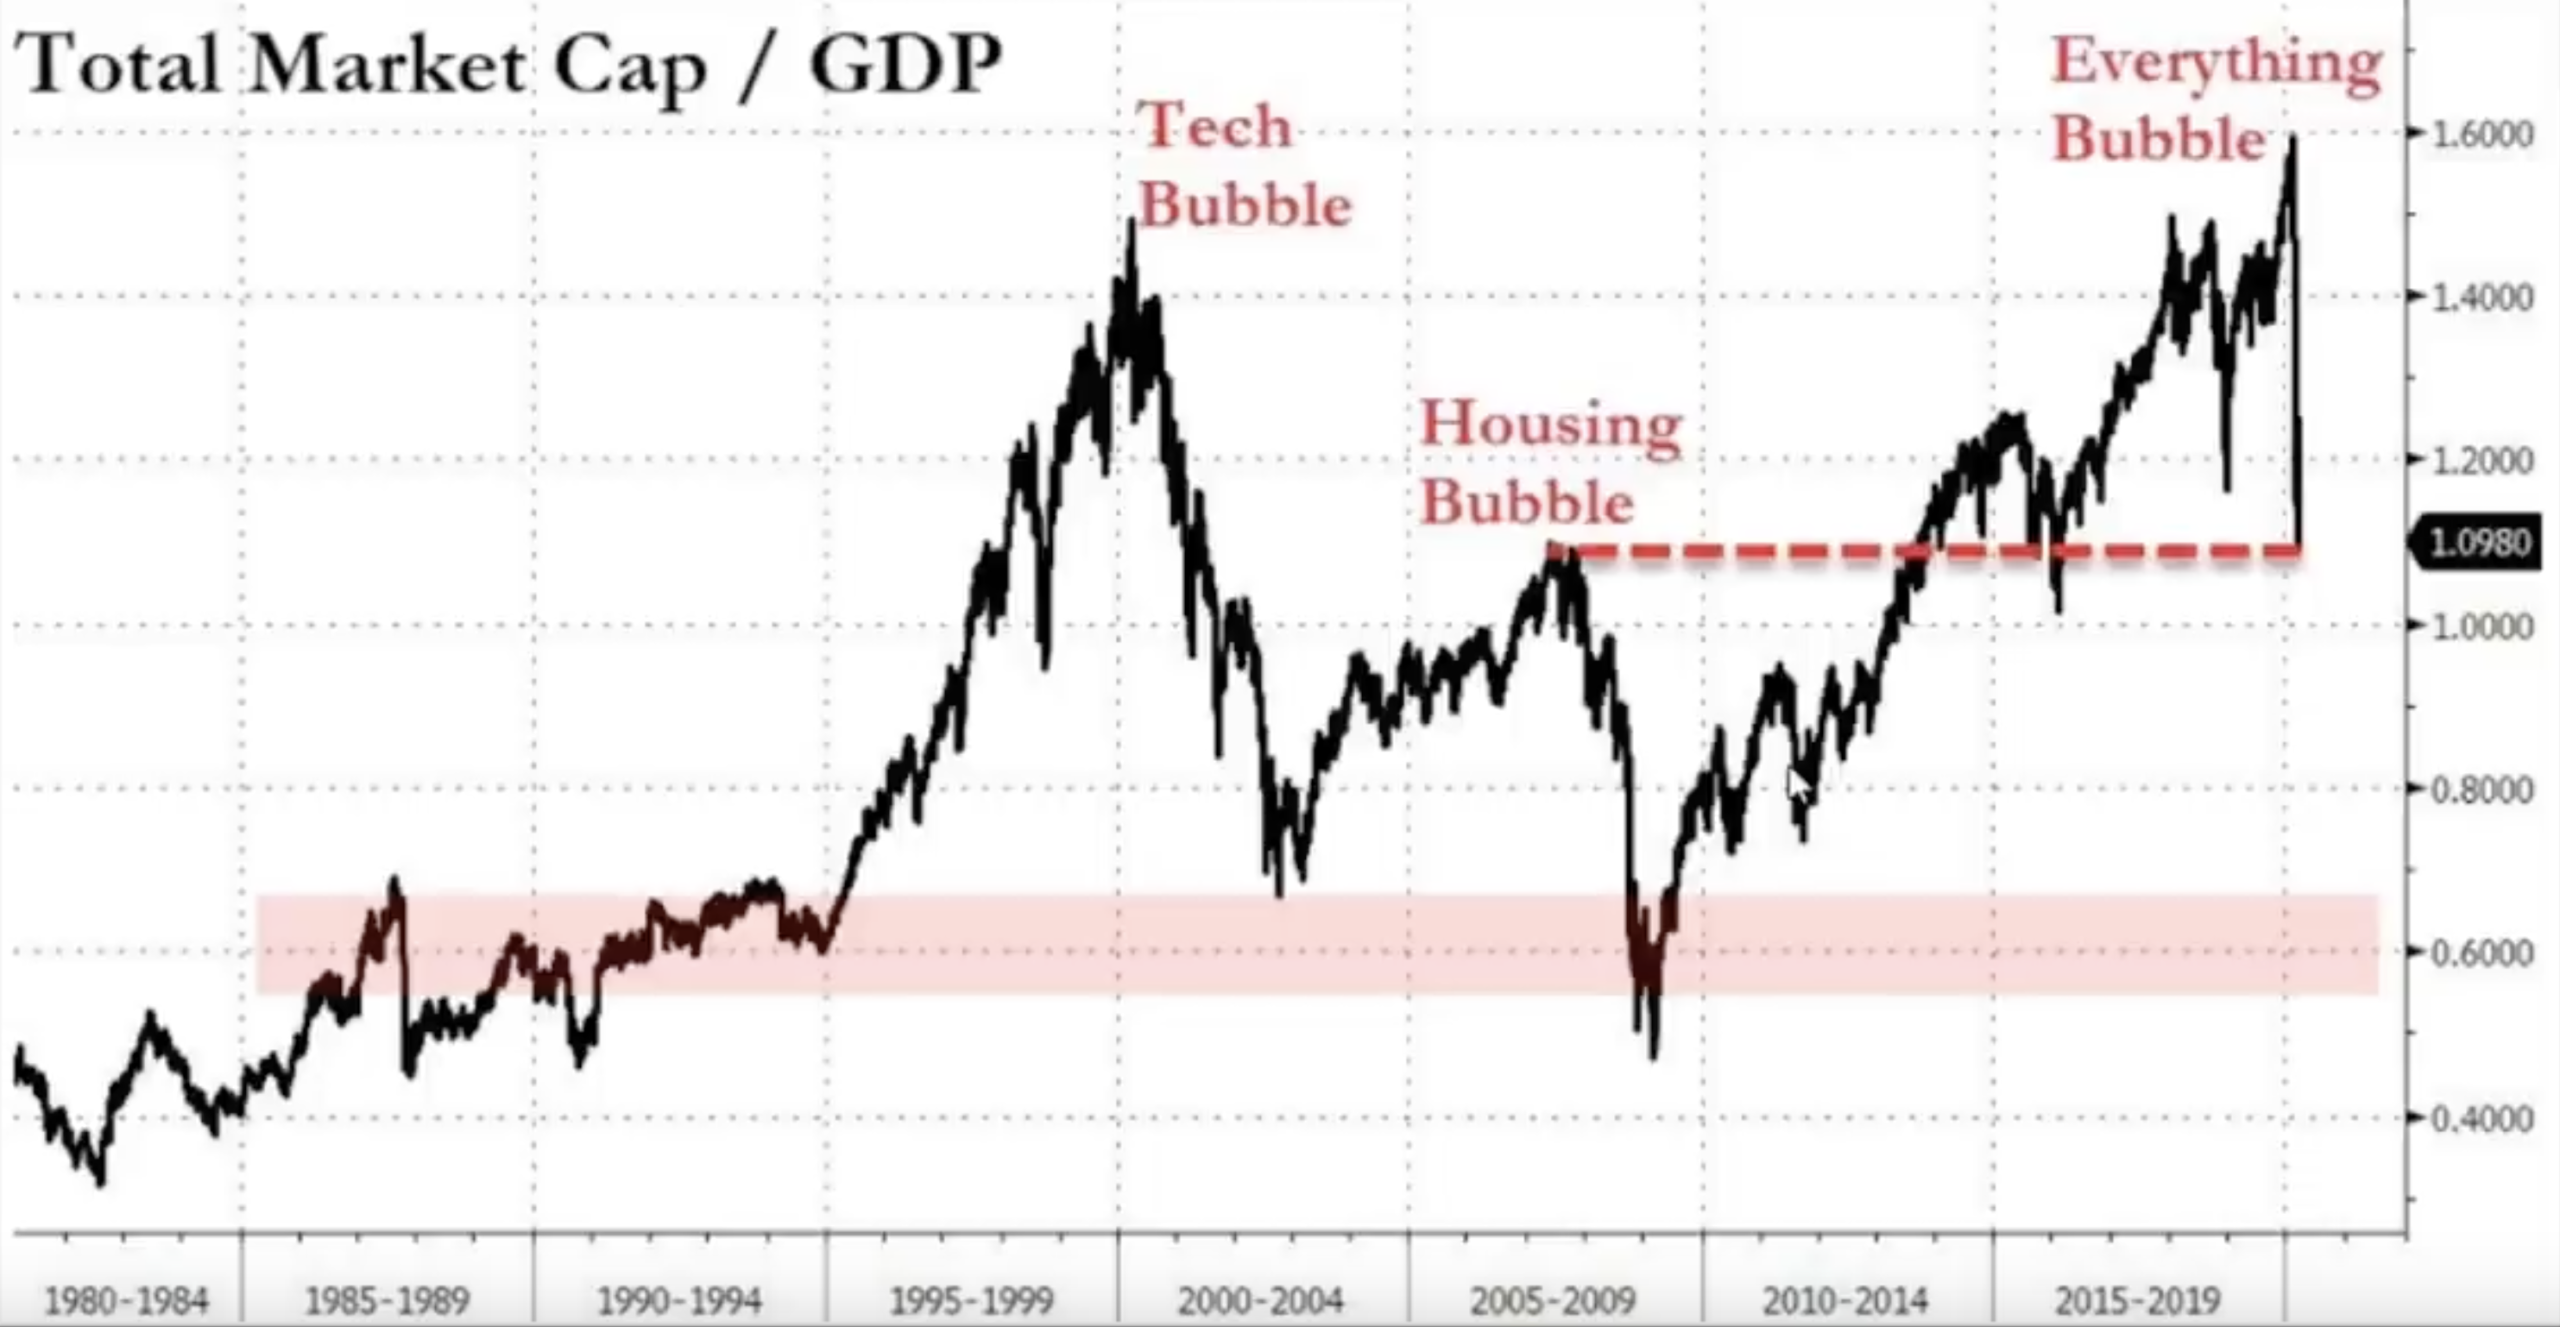
Was March 2020 a long term low?
The Covid19 crash of March 2020 bottom was still high and stocks merely fell back to 2008 peak levels when compared to GDP:
You still have a small window of time to prepare for a scenario most investors don’t even know is possible — and now even more likely.