 |
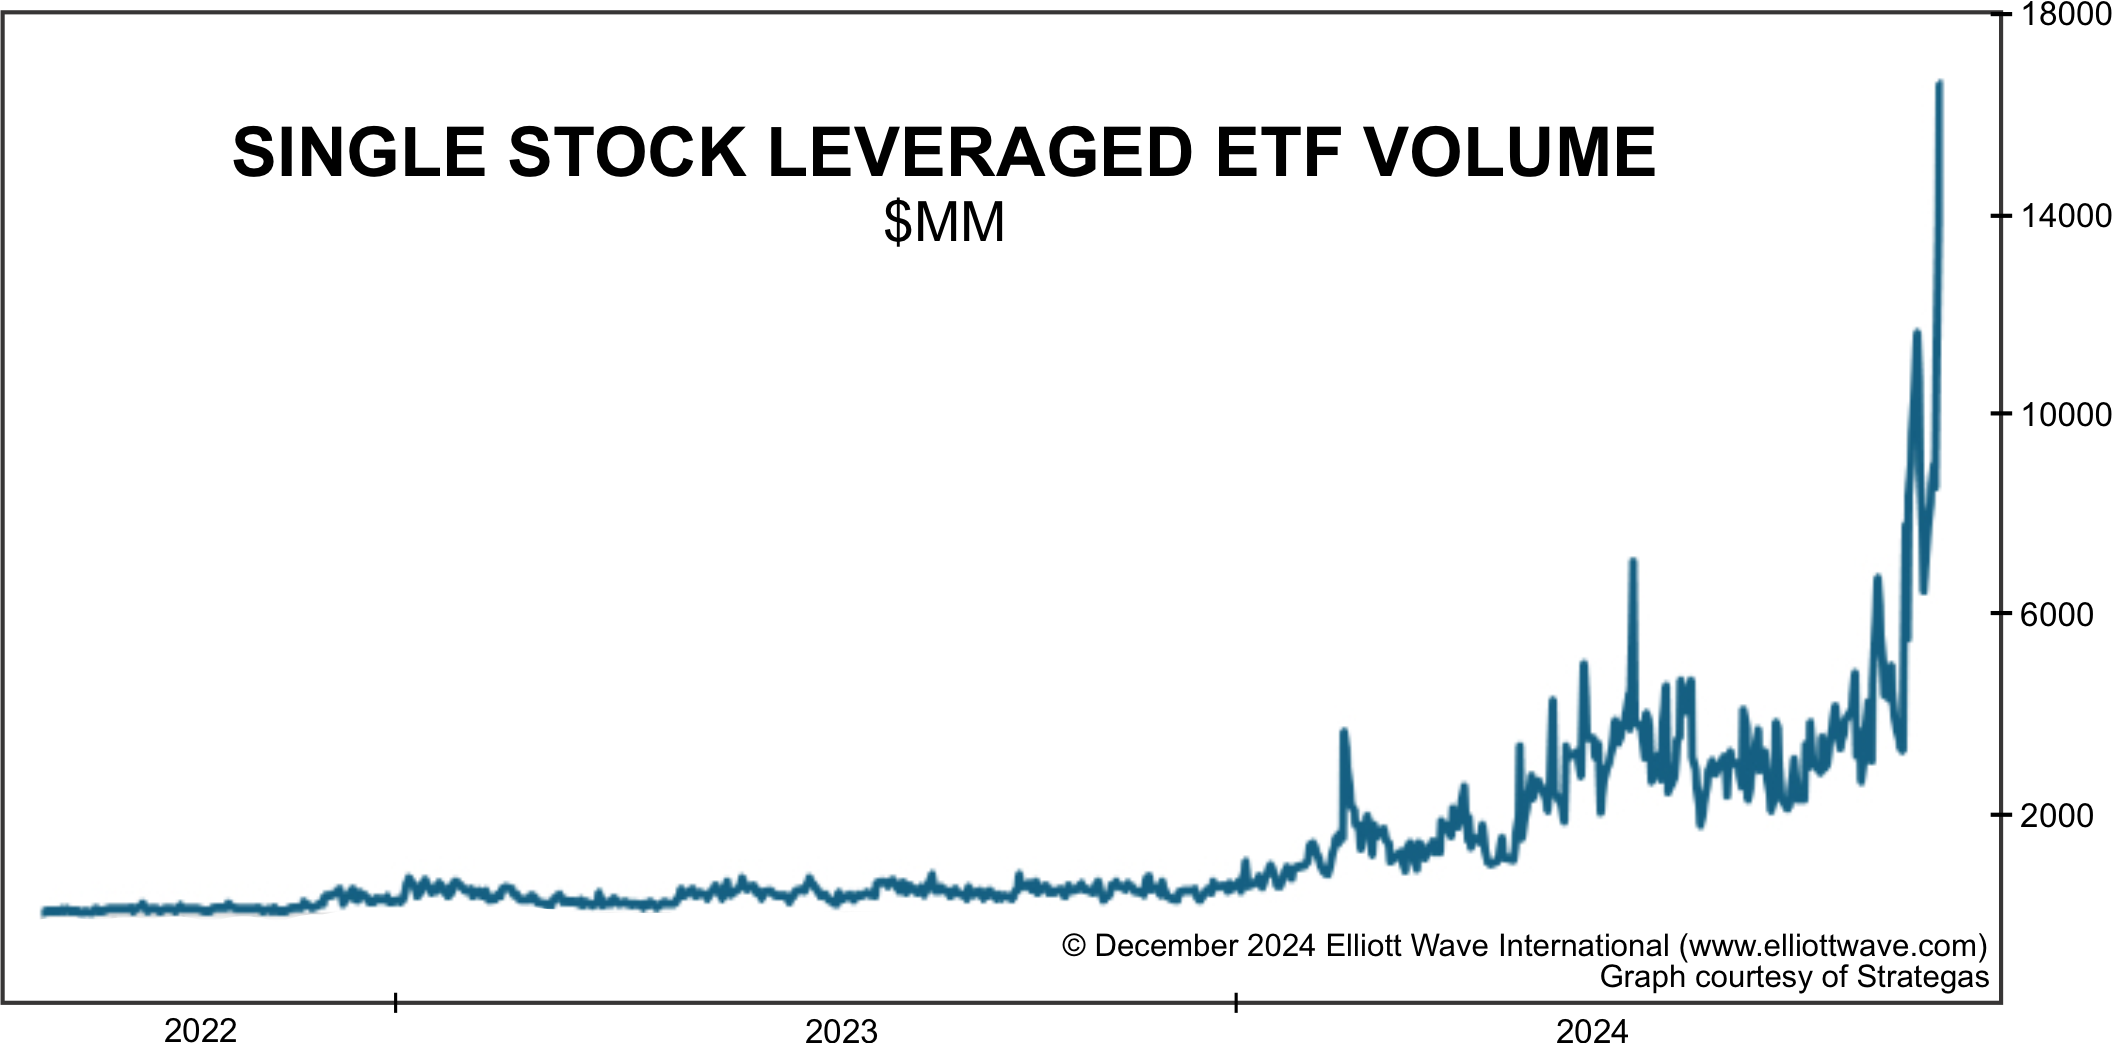
‘Investors always want the most at the END of any advance’ On December 6, within two days of the Dow’s all-time high, the Elliott Wave Financial Forecast offered this unique insight: “Leverage is investors’ real-money way of expressing an extremely positive social mood, which prompts the thought, “I want more.” Investors always want the most… Read more Extremes at the Peak |
Category: Stock Market
Articles about stock market, market timing, technical indicators, stock market trends, market top, market bottom.
Tesla’s Troubles – Is it Musk or is it More?
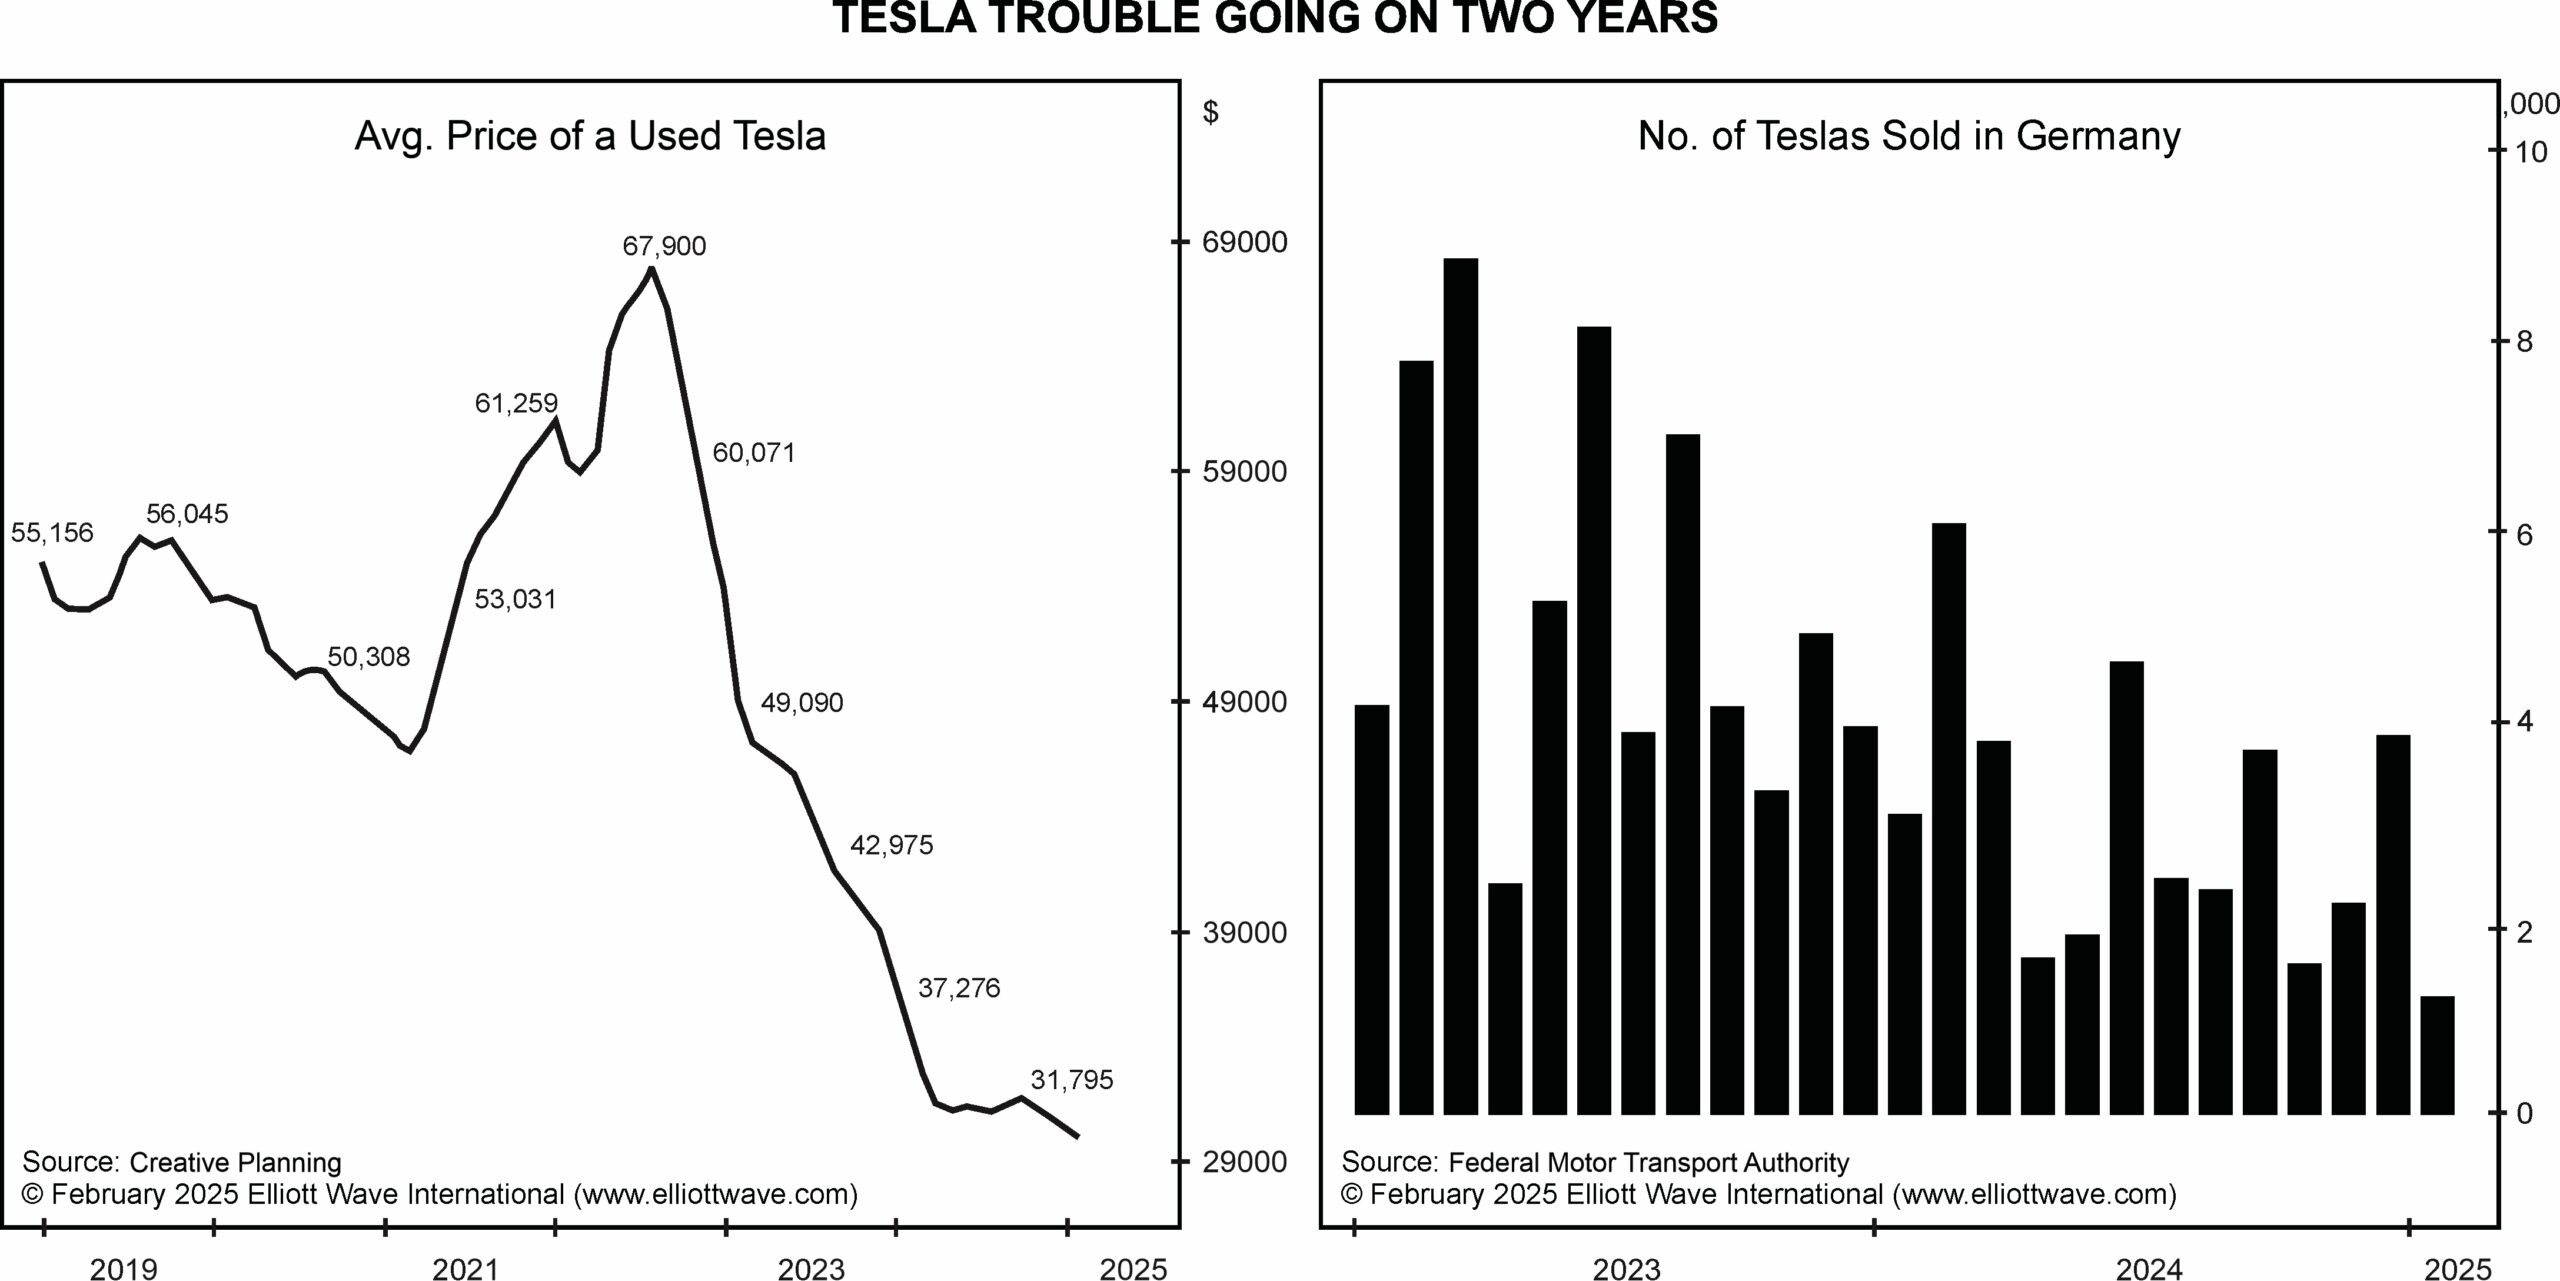 |
Tesla’s Troubles — Is it Musk or is it More? Tesla tumbled 15% on March 10, its biggest single day drop in more than five years. Elliott Wave International’s March Global Market Perspective provides this insight: The world’s richest man, Elon Musk, is also more vulnerable than most people realize. In March 2023, when a… Read more Tesla’s Troubles – Is it Musk or is it More? |
Stock Market Excessive Overvaluation in 2025
 |
Valuations Are at the Furthest Edge of the Financial Solar System Figure 1 updates our history of year-end valuations for stocks of S&P companies on two bases: price to book value (Y axis) and dividend yield (X axis). I thought the year-end 2021 overvaluation would never be surpassed. But as you can see, the year-end… Read more Stock Market Excessive Overvaluation in 2025 |
Another Extreme Sentiment in Stocks
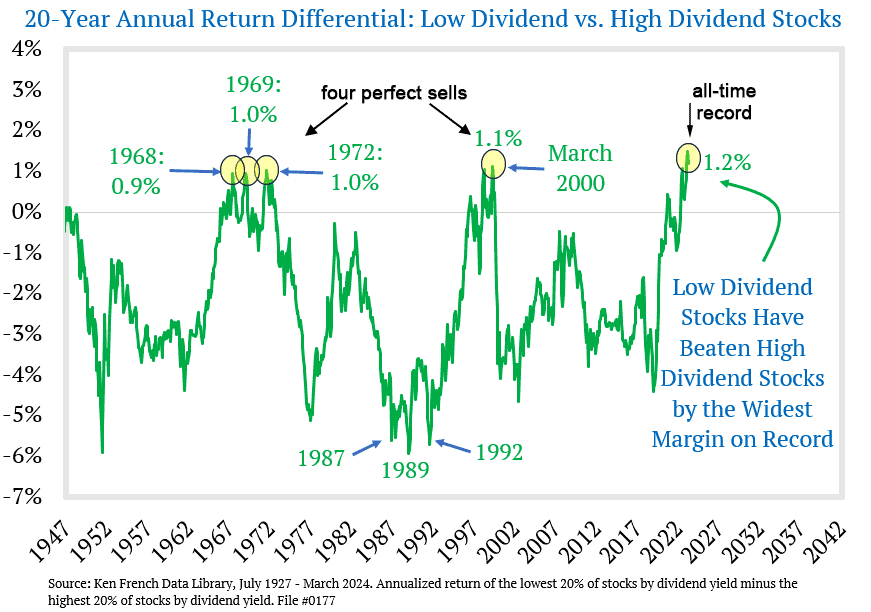 |
Why Stock-Market Success Is Usually Only Temporary Here’s a sample of record sentiment readings for stocks Recession coming or not, people are still EXTREMELY bullish. Read this excerpt from the May 17, 2024 Elliott Wave Theorist: Record Sentiment Readings for Stocks Investors are enamored with stocks that pay little or nothing in the way of… Read more Another Extreme Sentiment in Stocks |
Non-Confirmation in Europe
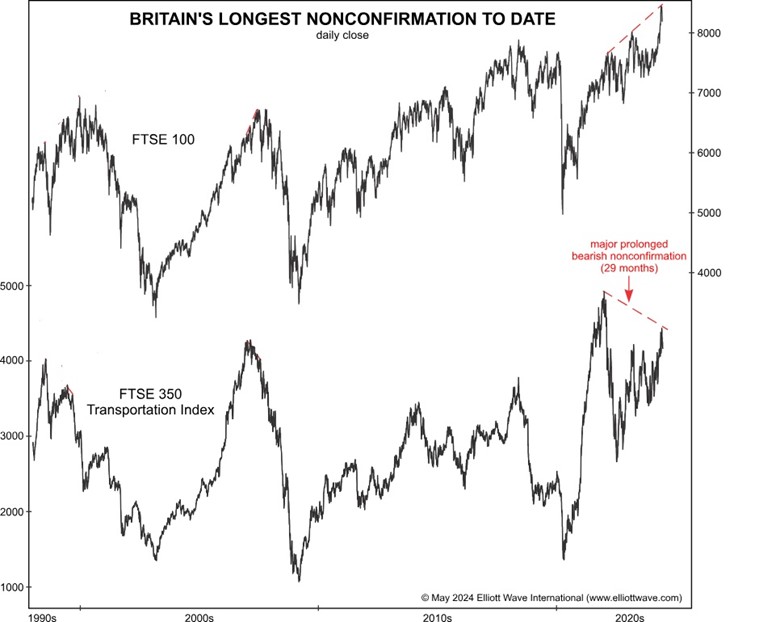 |
What You Can Learn from Europe’s “Dow Theory”-esque Non-confirmation By Brian Whitmer | European Financial Forecast editor Charles Dow (yes, the one with the averages named after him) developed a foundational concept in technical analysis that requires that price movement in industrial stocks and transportation shares confirm one another. The main condition for a Dow… Read more Non-Confirmation in Europe |
Calm in the markets
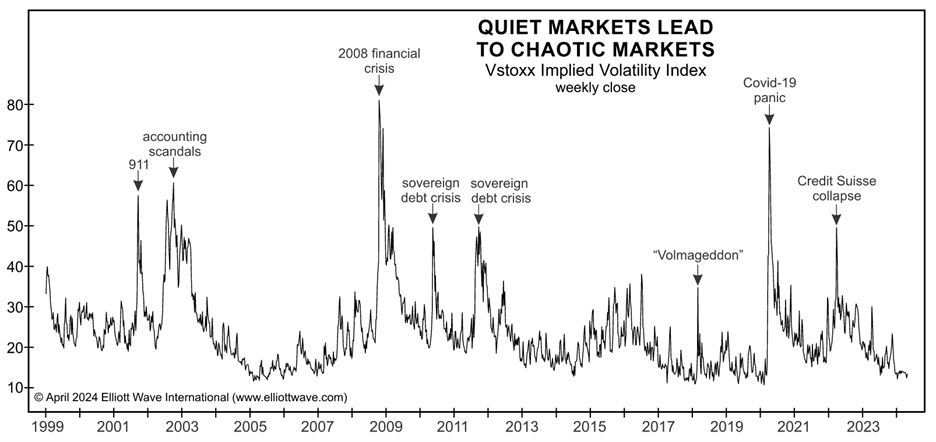 |
Stoxx Europe 600: What Signs of Investor Exuberance Keep Telling Us Every day, you read news stories about the state of the economy and the stock market affecting consumer and investor behavior. The story goes something like this: When the economy and financial markets show signs of improvement, consumers start to spend more, and investors… Read more Calm in the markets |
AI Revolution
 |
Global X Robotics & Artificial Intelligence ETF (BOTZ) looks like it is having a counter trend rally. This was foreseen as in the following article from Elliot Wave International back in March 2024: AI Revolution and NVDA: Why Tough Going May Be Ahead “These things could get more intelligent than us” The topic with all… Read more AI Revolution |
Time Tested Indicator
 |
Why You Should Pay Attention to This Time-Tested Indicator Now “How High Can Markets Go?” — asks this magazine cover Paul Montgomery’s Magazine Cover Indicator postulates that by the time a financial asset makes it to the cover of a well-known news weekly, the existing trend has been going on for so long that it’s… Read more Time Tested Indicator |
Bullish Buzz at Highest Level
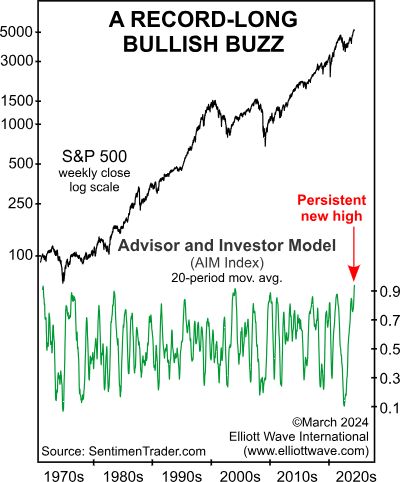 |
This “Bullish Buzz” Reaches Highest Level in 53 Years Learn what the AIM Index reveals By Elliott Wave International Yes, there’s been a recent pickup in stock market volatility, but overall, bullish sentiment remains very much alive and well. Indeed, here’s a Feb. 18 Yahoo! Finance headline: A Bull Market is Here. On April 9,… Read more Bullish Buzz at Highest Level |
Insider Selling in Stocks
 |
Stocks: What to Make of All This Insider Selling Here are details of “The Great Cash-Out” Corporate insiders may sell the shares of their company for any number of reasons but one of them is not because they think the price is going up. In other words, insider selling can serve as a warning. For… Read more Insider Selling in Stocks |